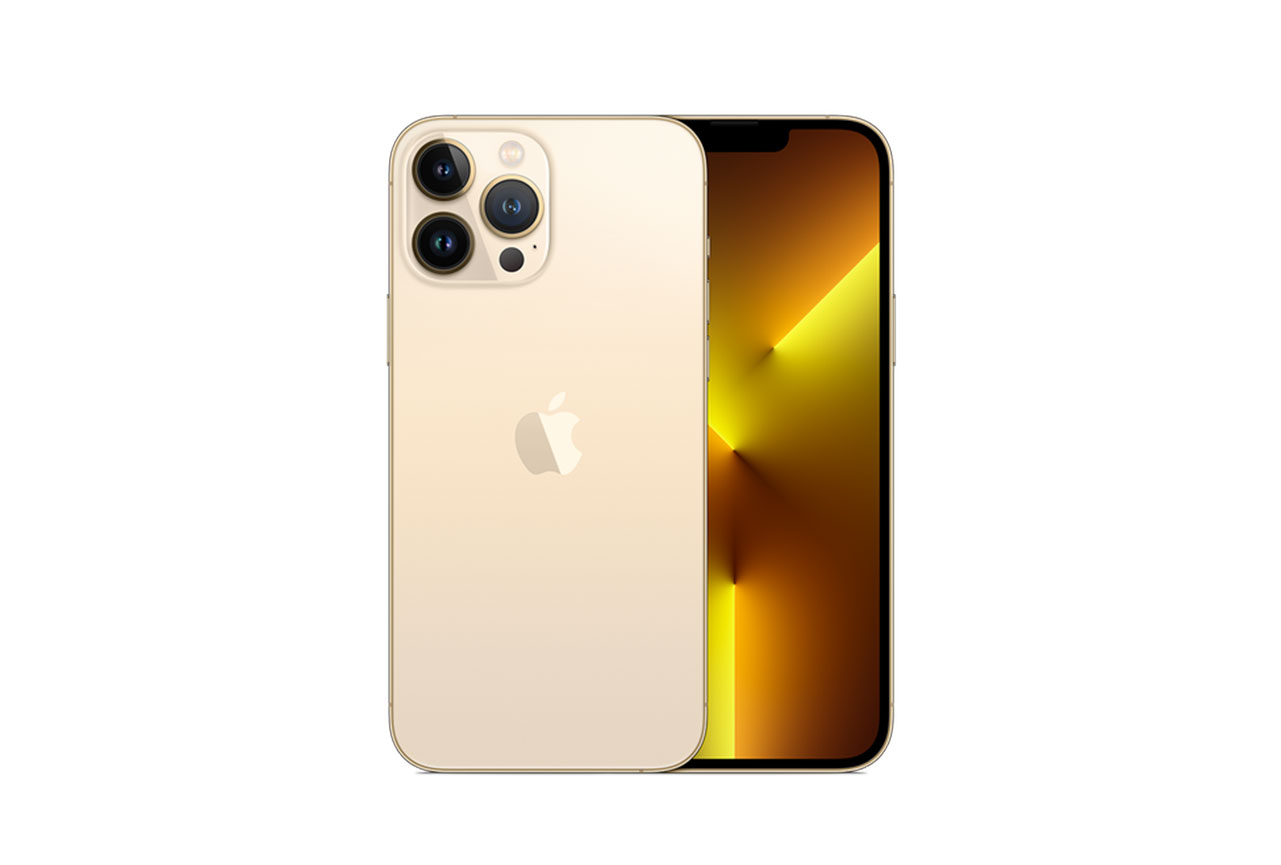
Arriving on the market in September 2021, the highly anticipated Apple iPhone 13 Pro Max fits into our Ultra-premium (800€ and higher) segment and comes with a completely reworked triple-camera setup, among other tantalizing features. Apple also highlights that the 13 Pro Max is capable of 2.5 more hours of battery life than its predecessor. Let’s take a look at some of its key battery test results.
Key specifications:
- Battery capacity: 4352 mAh
- 20W charger (not included)
- 6.7-inch, 1284 x 2778, 120 Hz OLED display
- Apple A15 Bionic (5 nm) chipset
- Tested ROM / RAM combination: 256 GB + 6 GB
About DXOMARK Battery tests: For scoring and analysis in our smartphone battery reviews, DXOMARK engineers perform a variety of objective tests over a week-long period both indoors and outdoors. This article highlights the most important results of our testing. (See our introductory and how we test articles for more details about our smartphone Battery protocol.)
Test summary
 Apple iPhone 13 Pro Max


 6th
6th
 1st
1st
Pros
- Excellent autonomy — 68 hours of moderate use
- Excellent discharge efficiency
Cons
- Slow charging
The Apple iPhone 13 Pro Max has posted a new top score in its segment, surpassing the previous top scorer, the iPhone 12 Pro Max, by 11 points. This significant achievement is due mainly to improved autonomy, which is attributable to the 13 Pro Max’s nearly 20% greater battery capacity, along with additional optimization. Other competitors in this review are less efficient and provide less autonomy despite having larger or similar-sized batteries.
We compared the Apple iPhone 13 Pro Max’s performance in several key categories with three other Ultra-premium devices, the Apple iPhone 12 Pro Max, the Samsung Galaxy S21 Ultra 5G (Snapdragon), and the Oppo Find X3 Pro; battery capacity, charger, display type and refresh rate, display resolution, and processor specifications for all four devices are shown in the table below.
| Apple iPhone 13 Pro Max | Apple iPhone 12 Pro Max | Samsung Galaxy S21 Ultra 5G (snapdragon) | Oppo Find X3 Pro | |
| Battery capacity | 4352 mAh | 3687 mAh | 5000 mAh | 4500 mAh |
| Charger | 20W, not included | 20W, not included | 25W, not included | 65W, included |
| Wireless | 15W | 15W | 15W | 30W |
| Display type | OLED, 120 Hz | OLED, 60 Hz | OLED, 120 Hz | OLED, 120 Hz |
| Display resolution | 2778 x 1284 | 2778 x 1284 | 2400 x 1080 | 2412 x 1080 |
| Chipset | A15 Bionic | A14 Bionic | Snapdragon 888 5G | Snapdragon 888 5G |
Autonomy (84)
How long a battery charge lasts depends not only on battery capacity but also on other aspects of the phone’s hardware and software. The DXOMARK Battery autonomy score is composed of three performance sub-scores: (1) Stationary, (2) On the go, and (3) Calibrated use cases. Each sub-score comprises the results of a comprehensive range of tests for measuring autonomy in all kinds of real-life scenarios.
In this very demanding segment, autonomy is often sacrificed in favor of ever more high-performing features. But the iPhone 13 Pro Max sets a new standard in its segment, providing an astonishing 68 hours of autonomy with moderate use — far ahead of its competitors, and among the best performers in our database to date.
Battery Life (moderate)
 13th
13th
Battery Life (moderate)
 1st
1st

Stationary
Apple iPhone 13 Pro Max
90
104
A robot housed in a Faraday cage performs a set of touch-based user actions during what we call our “typical usage scenario” (TUS) — making calls, video streaming, etc. — 4 hours of active use over the course of a 16-hour period, plus 8 hours of “sleep.” The robot repeats this set of actions every day until the device runs out of power.
The Apple iPhone 13 Pro Max reaches almost 3 full days in our TUS test, one day longer than the Oppo Find X3 Pro and 10 hours more than the iPhone 12 Pro Max. Further, the 13 Pro Max shows an average drop of only 1% overnight.
It must be noted that the iPhone 13 Pro Max’s autonomy performance and battery indicator behaved erratically during the first iterations of our tests, with the phone showing significant power consumption during idle times — problems that users at large have also reported. The device’s power consumption during long idle periods significantly reduced its autonomy results in the earliest runs of our Typical Usage Scenario — for example, we measured a drop of 9% during the second night’s 8 hours of idle time! Our engineers believe this erratic behavior was indicative of the iPhone’s performing background optimization as part of its initial start-up routine, as the behavior disappeared after several days. The test results published here are based on the measurements we obtained after the device had stabilized.

On the go
Apple iPhone 13 Pro Max
75
96
Using a smartphone on the go takes a toll on autonomy because of extra “hidden” demands, such as the continuous signaling associated with cellphone network selection, for example. DXOMARK Battery experts take the phone outside and perform a precisely defined set of activities while following the same three-hour travel itinerary for each device.
The Apple iPhone 13 Pro Max came in first overall in our on the go tests among devices in its segment. It handily beat its predecessor and its rivals in all of our tests, with the exception of social apps, where the Samsung Galaxy S21 Ultra 5G (Snapdragon) performed a bit better.

Calibrated
Apple iPhone 13 Pro Max
78
100
For this series of tests, the smartphone returns to the Faraday cage and our robots repeatedly perform actions linked to one specific use case (such as gaming, video streaming, etc.) at a time. Starting from an 80% charge, all devices are tested until they have expended at least 5% of their battery power.
Although its performance was a bit mixed in our calibrated tests, once again the iPhone 13 Pro Max came in ahead of the competition overall.
Charging (73)
The DXOMARK Battery charging score is composed of two sub-scores, Full charge and Quick boost. Full charge tests assess the reliability of the battery power gauge; measure how long it takes to charge a battery from zero to 80% capacity and from 80 to 100%; and measure how long and how much power the battery takes to go from an indicated 100% to an actual full charge. With the phone at different charge levels (20%, 40%, 60%, 80%), Quick boost tests measure the amount of charge the battery receives after being plugged in for 5 minutes.
Charging remains a weak point for the Apple iPhone 13 Pro Max, as it is still stuck using a 20W charger (not included) to fill a battery whose size is finally on par with the competition’s. It scored one point less than the 12 Pro Max, which has a smaller battery and uses the same size charger. Of the devices tested here, the Oppo Find X3 Pro is the clear winner with a score of 100.

Full charge
Apple iPhone 13 Pro Max
73
121
Both the iPhone 13 Pro Max and the 12 Pro Max reach 80% capacity in about an hour, with the 12 Pro Max just a bit ahead of its newer sibling. The closeness of their charging times is indicative of the 13 Pro Max having been optimized to offer the same charging experience with a bigger battery.
For wireless charging, the 13 Pro Max is even a little faster than the older model, reaching 80% in 1 hour 52 minutes vs 2 hours 16 minutes for the 12 Pro Max.
The Oppo Find X3 Pro is much faster for both wired and wireless charging.
Charging Time 0-80%
 76th
76th
Charging Time 0-80%
 18th
18th

Quick boost
Apple iPhone 13 Pro Max
72
111
Same charging speed and efficiency, iPhone 13 Pro Max recovers the same autonomy in a quick 5-minute charge as the 12 Pro Max, about 3 hours, which is roughly half the performance of Find X3 Pro.
| Apple iPhone 13 Pro Max | Apple iPhone 12 Pro Max | Samsung Galaxy S21 Ultra 5G (Snapdragon) | Oppo Find X3 Pro | ||
| Autonomy boost (hh:mm) | 20% | 3:11 | 3:17 | 3:24 | 5:49 |
| 40% | 3:18 | 3:16 | 3:22 | 6:36 | |
| 60% | 3:02 | 3:03 | 2:54 | 4:40 | |
| 80% | 1:35 | 1:24 | 2:11 | 3:25 | |
| Percentage boost | 20% | 6.3 % | 8.2 % | 9.2 % | 18.4 % |
| 40% | 6.5 % | 8.2 % | 9.1 % | 20.9 % | |
| 60% | 6 % | 7.6 % | 7.8 % | 14.7 % | |
| 80% | 3.1 % | 3.5 % | 5.9 % | 10.8 % | |
| Energy consumed | 20% | 1621 mWh | 1768 mWh | 2279 mWh | 4020 mWh |
| 40% | 1678 mWh | 1764 mWh | 2262 mWh | 4563 mWh | |
| 60% | 1545 mWh | 1645 mWh | 1950 mWh | 3223 mWh | |
| 80% | 802 mWh | 761 mWh | 1468 mWh | 2360 mWh |
Efficiency (95)
The DXOMARK power efficiency score consists of two sub-scores, Charge up and Discharge rate, both of which combine data obtained during robot-based typical usage scenario testing, outdoor mobility testing, charging evaluation, and power measurements, and then take into consideration the device’s battery capacity.
The Apple iPhone 13 Pro Max showed very similar behavior to that of the 12 Pro Max and outscored the competition in this category despite a very inefficient charge up performance, thanks to its outstanding discharge efficiency.

Charge up
Apple iPhone 13 Pro Max
56
105
Both iPhones have very poor charge-up efficiency, with slow charging speeds that result in very long charging times to go from 80% to full capacity. The Apple devices have an overall charge efficiency of around 65%, whereas their competitors are close to 80%.

Discharge
Apple iPhone 13 Pro Max
115
121
In direct contrast to their poor charge-up efficiency, both iPhones have outstanding discharge efficiency, with similarly low discharge current in all usages, thus demonstrating significantly better optimization than their rivals.
Conclusion
Apple designs its own hardware, its own chipset, its operating system, and many of its applications, with each piece designed to work with the others. This design optimization means that both the iPhone 13 Pro Max and 12 Pro Max drain their batteries less when in use than many other devices. Now that Apple has furnished its new flagship iPhone with a 4352 mAh battery — a size that is comparable to those of other devices in its segment — it is little wonder that the 13 Pro Max has shown remarkable improvement in our autonomy measurements. We are now eager to see Apple bring out future models with faster charging speeds!

 English
 中文
中文


DXOMARK invites our readership (you) to post comments on the articles on this website. Read more about our Comment Policy.