 English
 中文
中文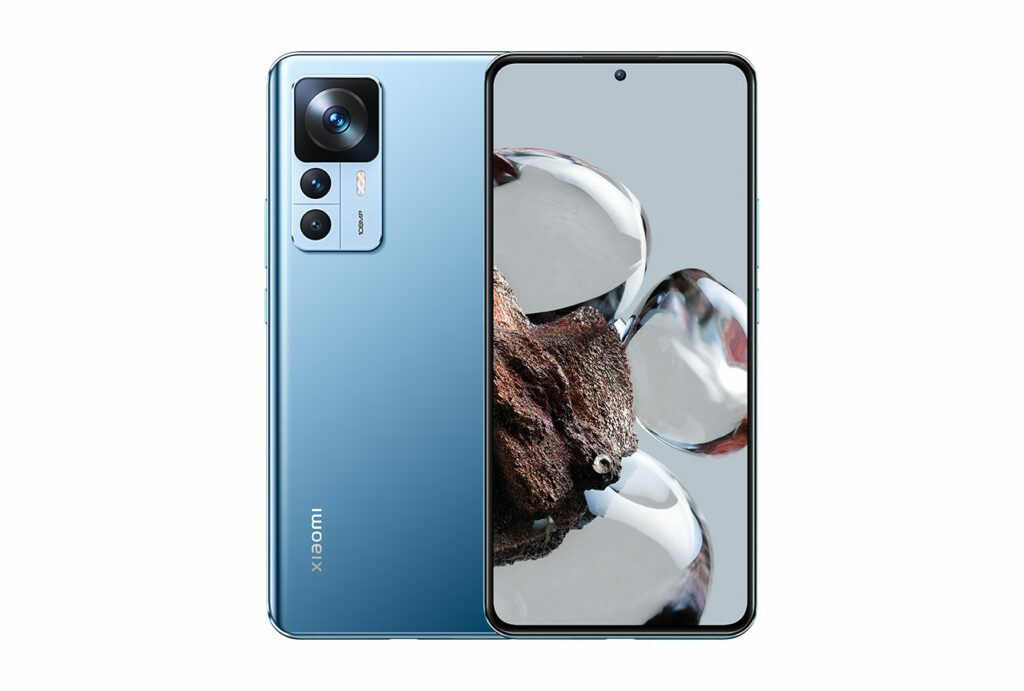
We put the Xiaomi 12T through our rigorous DXOMARK Display test suite to measure its performance across six criteria. In this test results, we will break down how it fared in a variety of tests and several common use cases.
Overview
Key display specifications:
- 6.67 inches AMOLED, (~87.4% screen-to-body ratio)
- Dimensions: 163.1 x 75.9 x 8.6 mm (6.42 x 2.99 x 0.34 inches)
- Resolution: 1220 x 2712 pixels, (~446 ppi density)
- Aspect ratio: 20:9
- Refresh rate: 120 Hz
Scoring
Sub-scores and attributes included in the calculations of the global score.
 Xiaomi 12T
Pros
- Smooth interactions in most usages
- Smooth light transitions
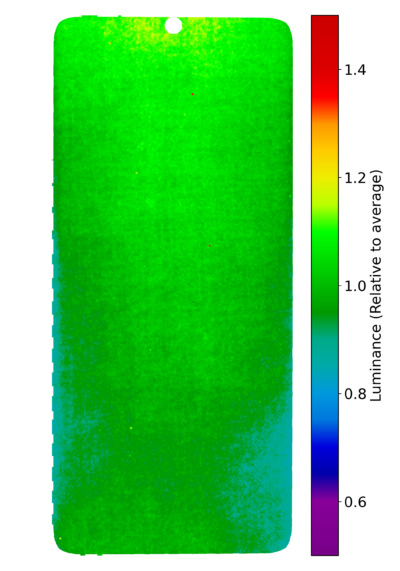
- Uniform screen color and brightness
Cons
- Hardly readable under sunlight
- Imprecise tone mapping makes HDR10 video content appear dark
- Shows many ghost touches
The Xiaomi 12T’s display provided a smooth experience in most usages. Color and brightness were uniform, and the screen’s adaptation to light transitions was smooth. The display’s readability, however, was challenged under sunlight conditions, making it difficult to read content. HDR videos also appeared to lack brightness on the screen.
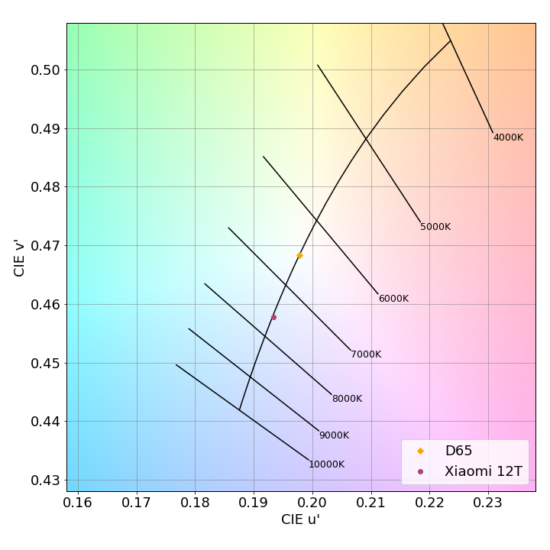
Still, the Xiaomi 12T’s display performance was an improvement over its predecessor, the Xiaomi 11T. The 12T’s display provided excellent smoothness, particularly during web browsing and viewing the photo gallery. Our testers saw an improvement over the 11T in color rendering and white-point management. Artifacts on the 12T were well-managed, flicker in particular, and the display’s touch performance was quite good.
However, readability on the 12T was not as good as on the 11T, even though the 12T’s score was more than 10 points higher than the 12T Pro version. Xiaomi’s website says the 12T’s display can reach a maximum 900 nits, but we measured brightness going up to 990 nits in sunlight.
The 12T’s display tone mapping, however, gave the impression of diminished screen brightness when watching HDR10 videos, compared with the 11T.
Overall, the High-end segmented 12T, which is fitted with MediaTek’s Dimensity 8100 Ultra chipset, managed to outperform the Premium-segmented 12T Pro, which is equipped with Qualcomm’s Snapdragon 8+ (Gen1) processor. This was also the case last year when the 11T also outperformed the 11T Pro version.
Test summary
About DXOMARK Display tests: For scoring and analysis in our smartphone and other display reviews, DXOMARK engineers perform a variety of objective and perceptual tests under controlled lab and real-life conditions. Note that we evaluate display attributes using only the device’s built-in display hardware and its still image (gallery) and video apps at their default settings. (For in-depth information about how we evaluate smartphone and other displays, check out our articles, “How DXOMARK tests display quality” and “A closer look at DXOMARK Display testing.”
The following section gathers key elements of our exhaustive tests and analyses performed in DXOMARK laboratories. Detailed performance evaluations under the form of reports are available upon request. Do not hesitate to contact us.
Readability
Xiaomi 12T
160
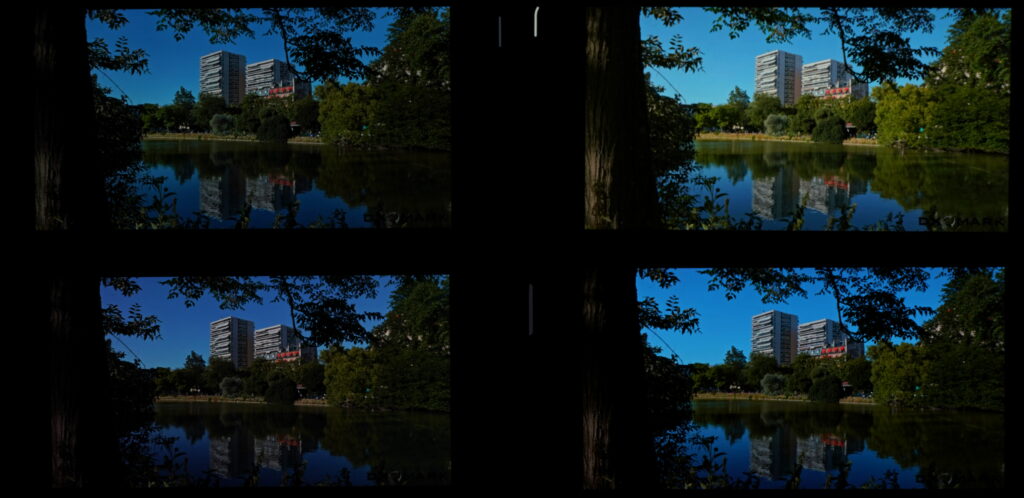
Readability evaluates how easily and comfortably users can read still content (photos & web) on the display under different real-life conditions. DXOMARK uses its Display Bench to recreate ambient light conditions ranging from total darkness to bright sunlight. In addition to laboratory tests, perceptual analysis is also made in real-life environments.


Color
Xiaomi 12T
163
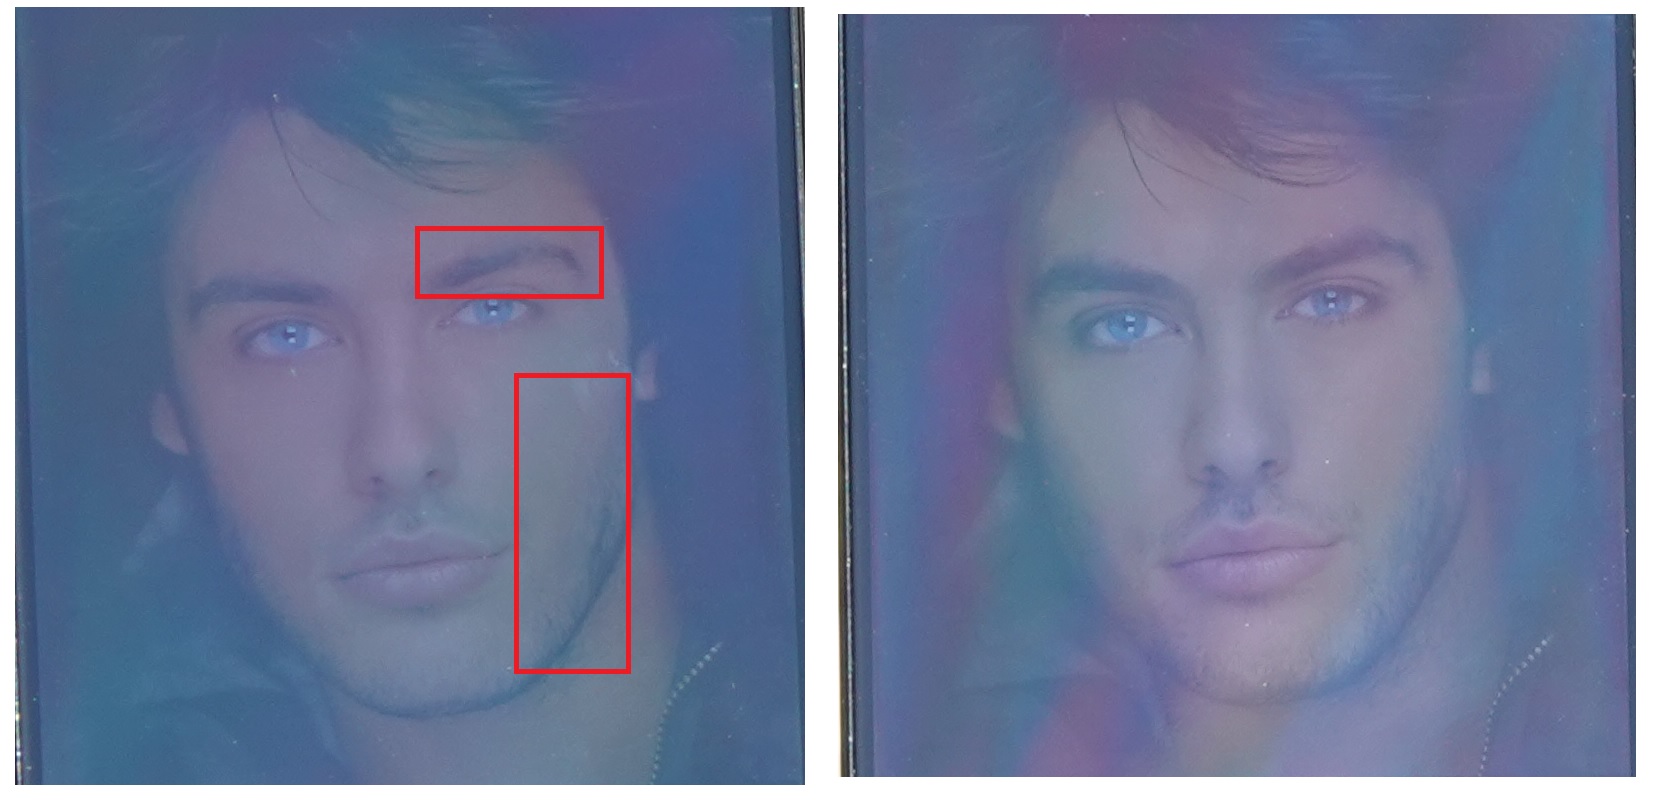
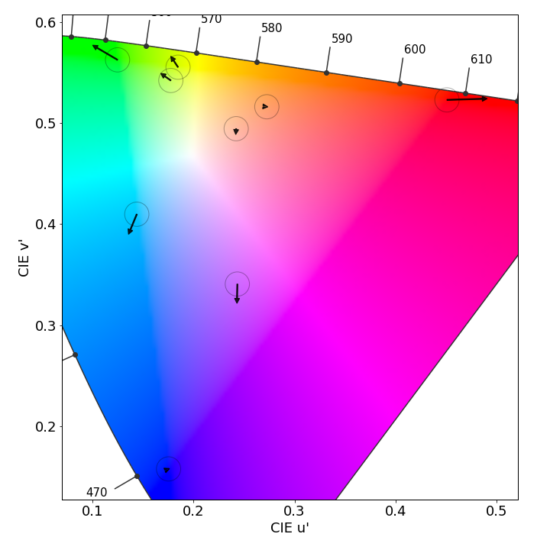
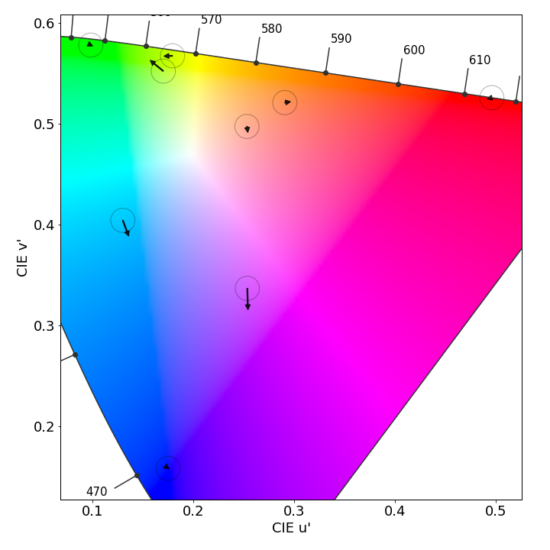
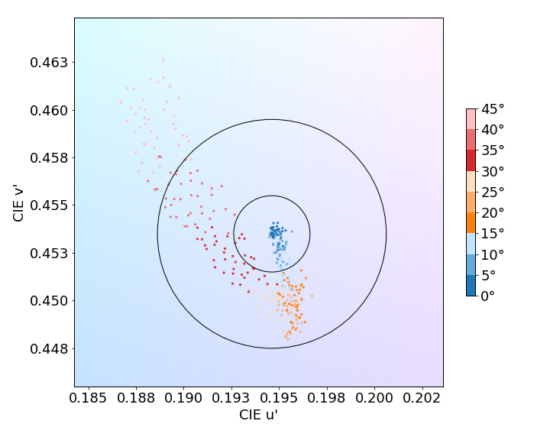
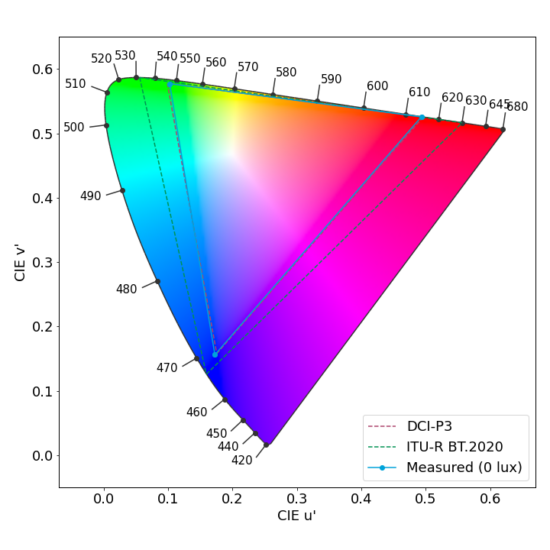
The color attribute evaluates the capacity of the device to accurately reproduce colors. The measurements taken are for fidelity, white point color, and gamut coverage. We perform color evaluations for different lighting conditions to see how well the device can manage color in the surrounding environment. Colors are measured using a spectrophotometer in a controlled lighting environment. Perceptual analysis of color rendering is against the reference pattern displayed on a calibrated professional monitor.
Video
Xiaomi 12T
162
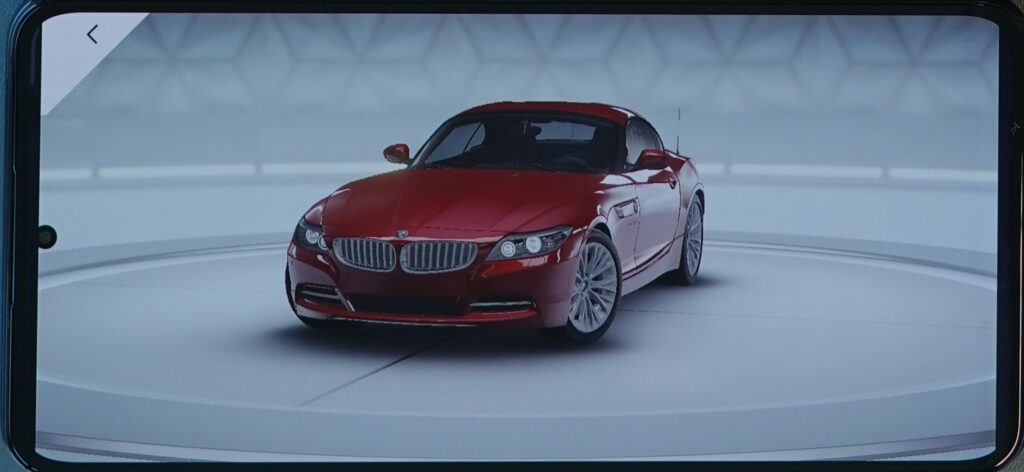
Our video attribute evaluates the Standard Dynamic Range (SDR) and High Dynamic Range (HDR10) video handling of each device in indoor and low-light conditions. We measure tone mapping, color gamut, brightness and contrast of the display. We perform perceptual analysis against our professional reference monitor (Sony BVM-HX310) to ensure that the rendering respects the artistic intent.

Motion
Xiaomi 12T
155
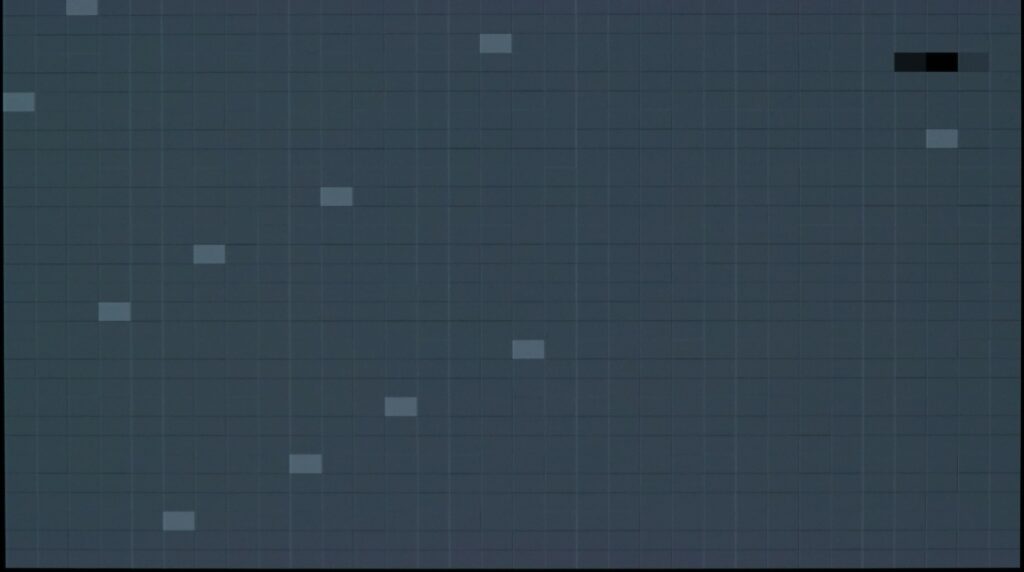
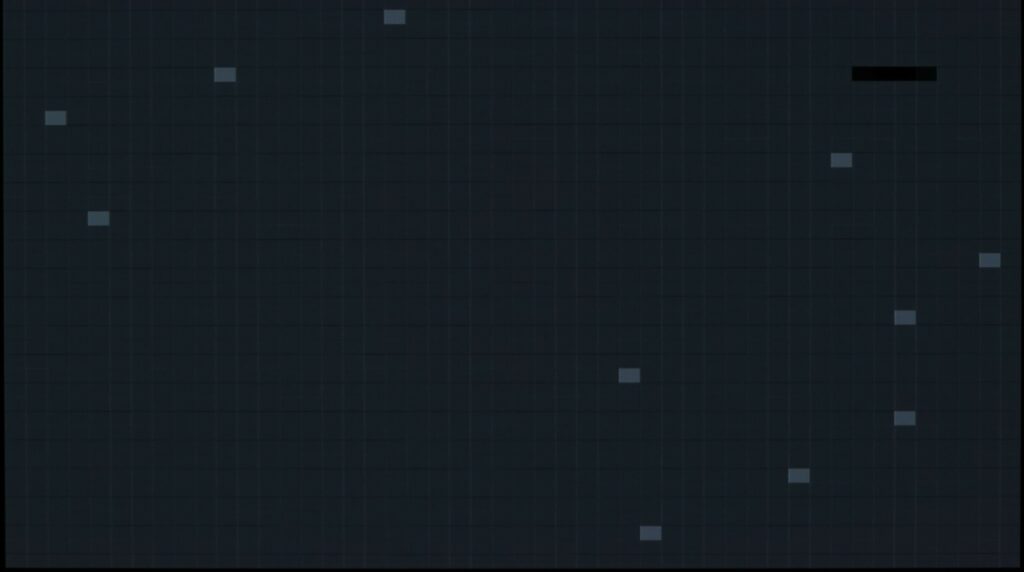
The motion attribute evaluates the handling of dynamic contents. Frame drops, motion blur, and playback artifacts are scrutinized using games and videos.
Touch
Xiaomi 12T
165
To evaluate touch, DXOMARK uses a touch robot and a high-speed camera to play and record a set of scenarios for smoothness, accuracy and response-time evaluation.
Xiaomi 12T 149Artifacts
Evaluating artifacts means checking for the performance, image rendering and motion flaws that can affect the end-user experience. DXOMARK measures precisely the device’s reflectance and the presence of flicker, and assesses the impact of residual aliasing when playing video games, among other characteristics.
DXOMARK invites our readership (you) to post comments on the articles on this website. Read more about our Comment Policy.