 English
 中文
中文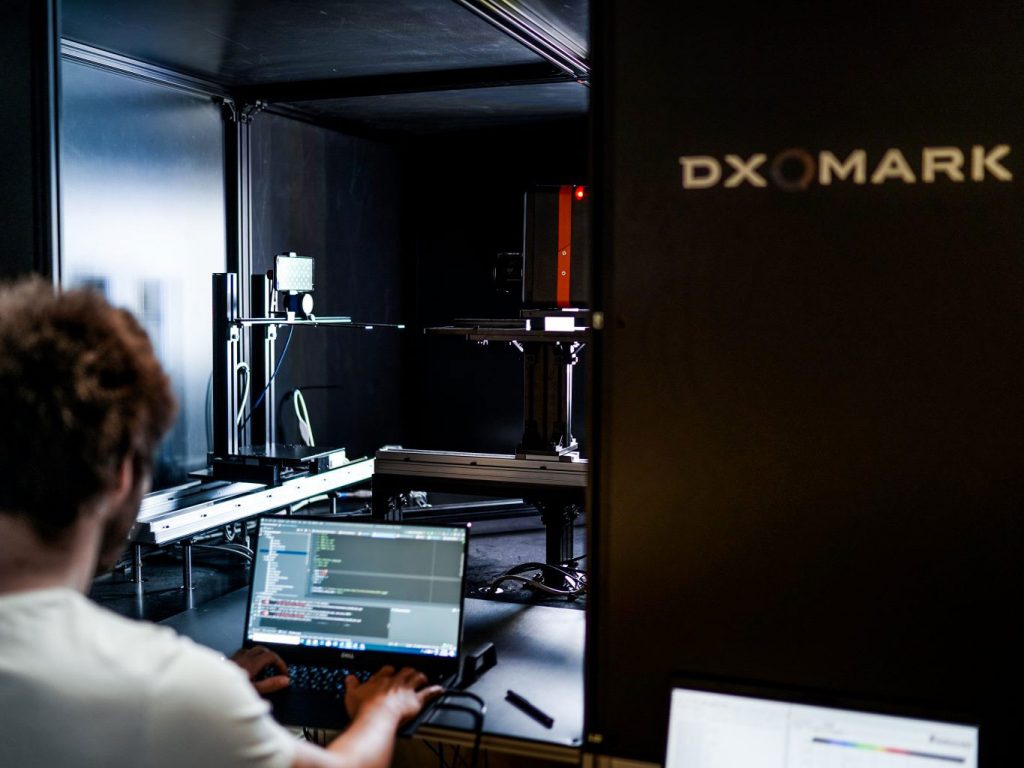
In the introductory article we published back in October when we launched our DXOMARK Display protocol and our first reviews, we promised we would provide a closer look at what goes into our display testing. We are planning a series of articles that will dive into many of the specifics of how we test each individual attribute (readability, color, video, motion, touch, artifacts), along with other articles that will focus on such display issues as flicker, SDR vs HDR, and so on. In this article, however, we want to give you a closer look at the kinds of tools DXOMARK uses to scientifically evaluate display quality attributes, which are based on specific use cases that reflect the most common ways in which people use their phones: web browsing, night reading, in-car navigation, taking photos, viewing photos, gaming, and watching movies, as well as how smoothly and efficiently a display’s auto-brightness function responds to changing light conditions.
Before we head into our main topic, let’s take a moment to remember that smartphone display performance isn’t just about display panel quality. Smartphones use programs or algorithms to control many display functions, and manufacturers choose which settings to use with those algorithms (a process known as “tuning”). Of course, some algorithms are more efficient than others, and the way an algorithm is implemented on a smartphone can make a big difference in performance, as in these examples:
- Software determines how smartphones balance the trade-off between frame rate and battery usage; depending on the apps used, some phones automatically adjust the frame rate to extend a battery charge (and thus autonomy). What this means is that a smartphone with a refresh rate of 120 Hz does not always refresh the screen at 120 Hz (for example).
- Many smartphones include an ambient light sensor, a photodetector that gauges surrounding lighting conditions; tuning determines how quickly and appropriately the auto-brightness feature responds to the input from the light sensor, in addition to how well the display adapts to the content being viewed.
- When people watch videos on their phones, motion interpolation algorithms generate frames in between “real” (existing) frames with the aim of making animations or moving actions appear smoother, and again, the battery vs. frame rate trade-off can have an impact here. (We will visit algorithms again in some of our articles about specific display attributes.)
DXOMARK conducts tests under many different (and sometimes changing) light conditions so as to recreate as closely as possible the real-world experiences of smartphone users, rather than just simply pitting display performance against “ideal” viewing conditions as defined in standards/norms.
Finally, as we head into our toolbox, just a short reminder that first, we test each and every display under the exact same conditions so as to ensure that our results are fair, scientifically rigorous, and repeatable. Second, apart from certain well-defined exceptions, we always test devices using their default settings. And third, DXOMARK measurements differ from those of other sites in that we not only include lab-based objective measurements, but perceptual measurements as well.
Objective testing tools
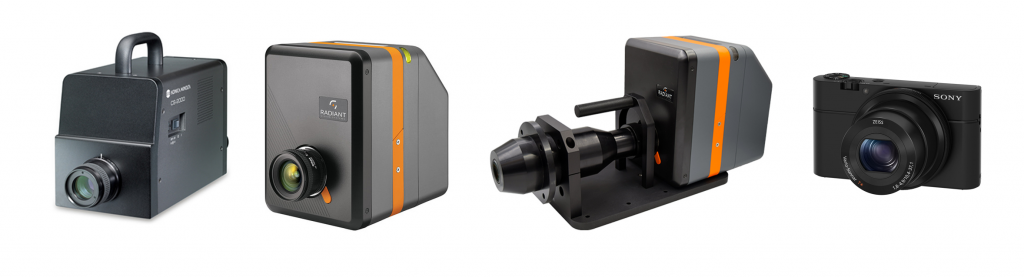
The images below show the array of tools our evaluation experts use when testing smartphone display performance. We use the tools below to measure color, luminance (brightness), and contrast, and to count frame drops:
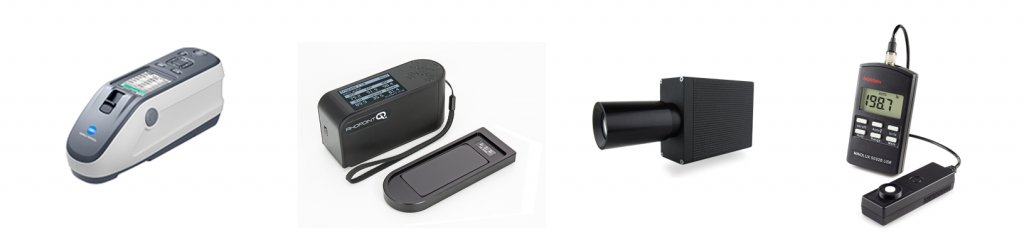
We use these tools to measure reflectance, gloss, flicker, and illuminance:
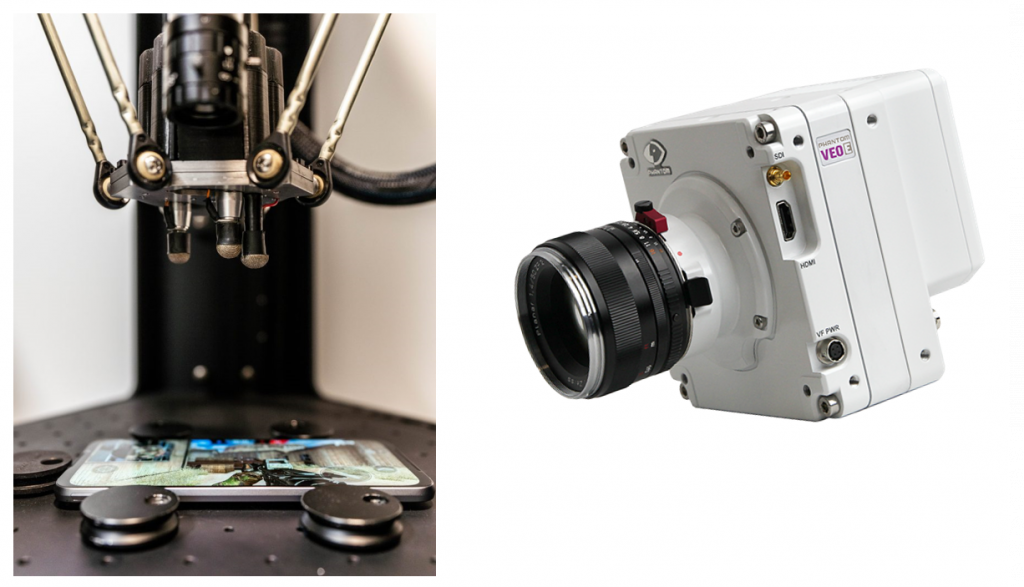
We use the tools below to measure touch responsiveness, accuracy, and smoothness:
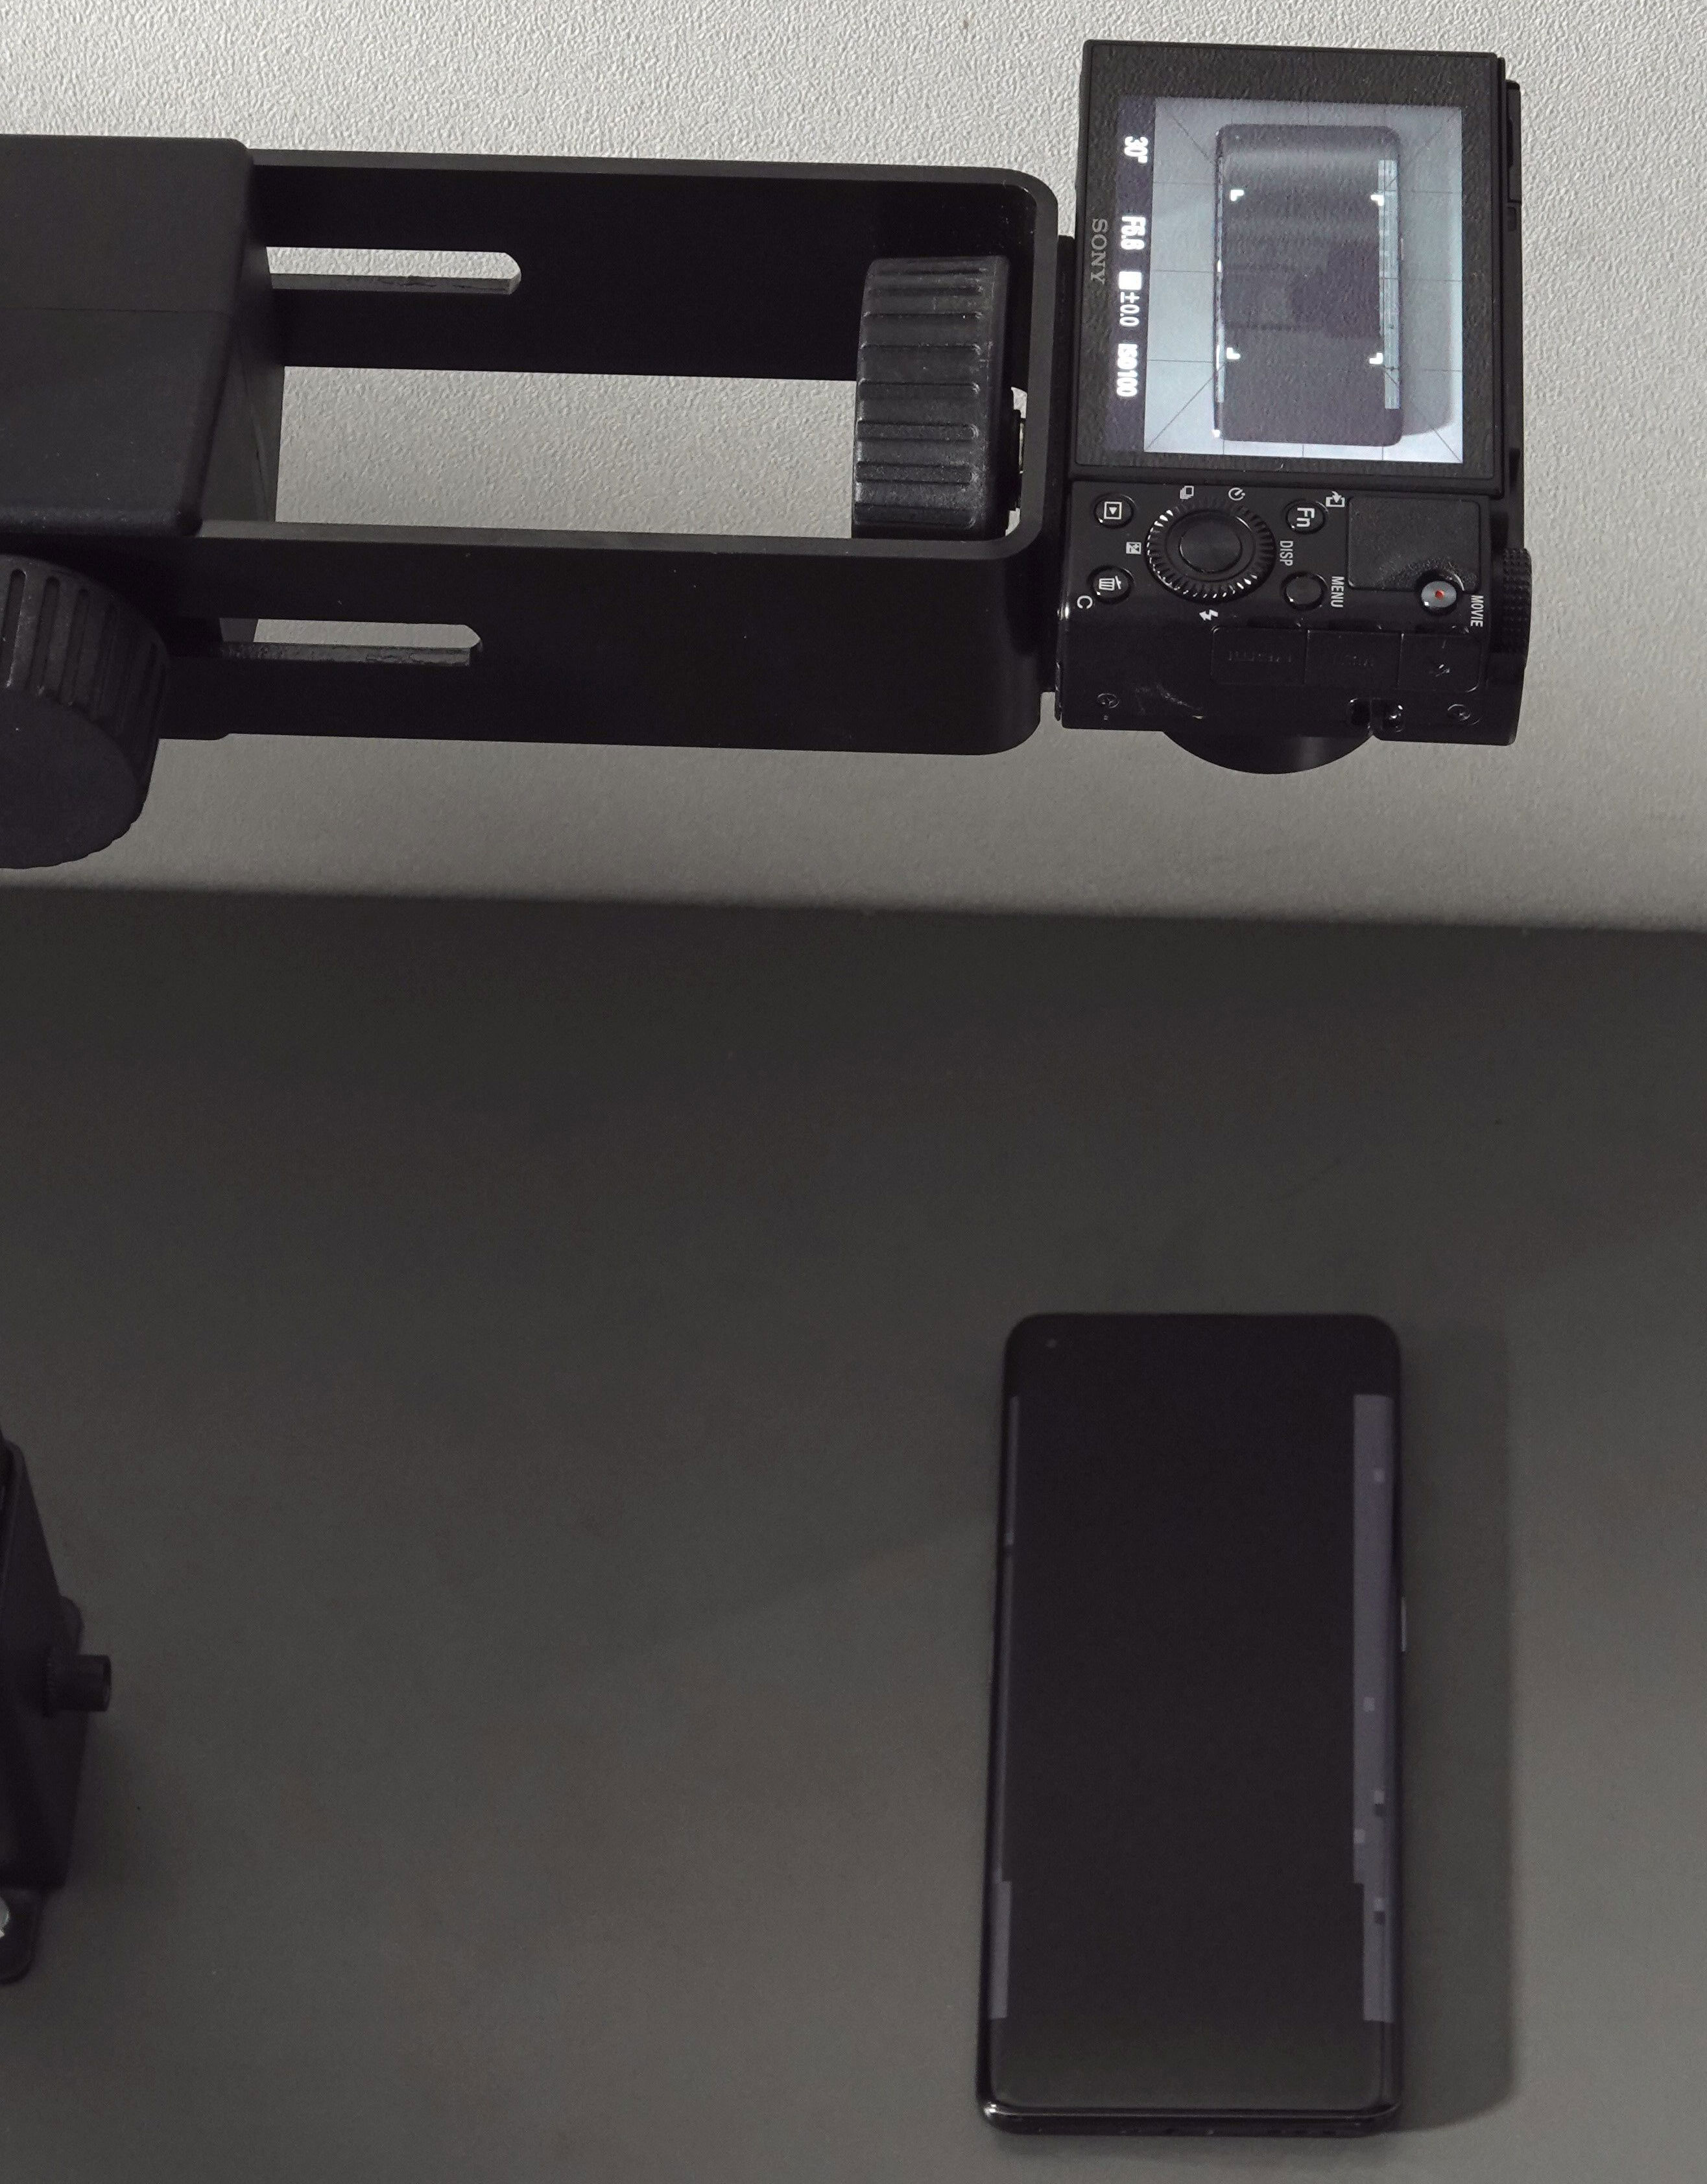
We conduct many of our objective tests within the DXOMARK Display Bench, which we unveiled at launch; the Bench is a special testing chamber that facilitates testing automation and ensures that our engineers test all devices under the exact same conditions. It includes mounts for devices being tested and for testing tools (principally a spectroradiometer and a video colorimeter), computer-controlled LED lighting arrays to imitate all kinds of lighting types and brightness levels, and lux meters.
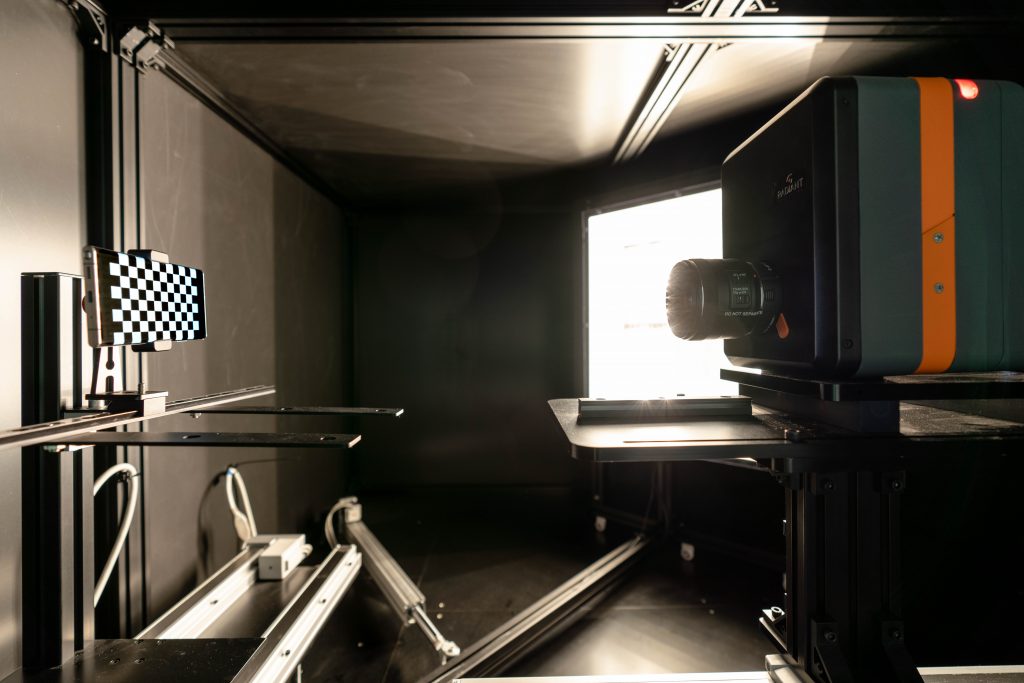
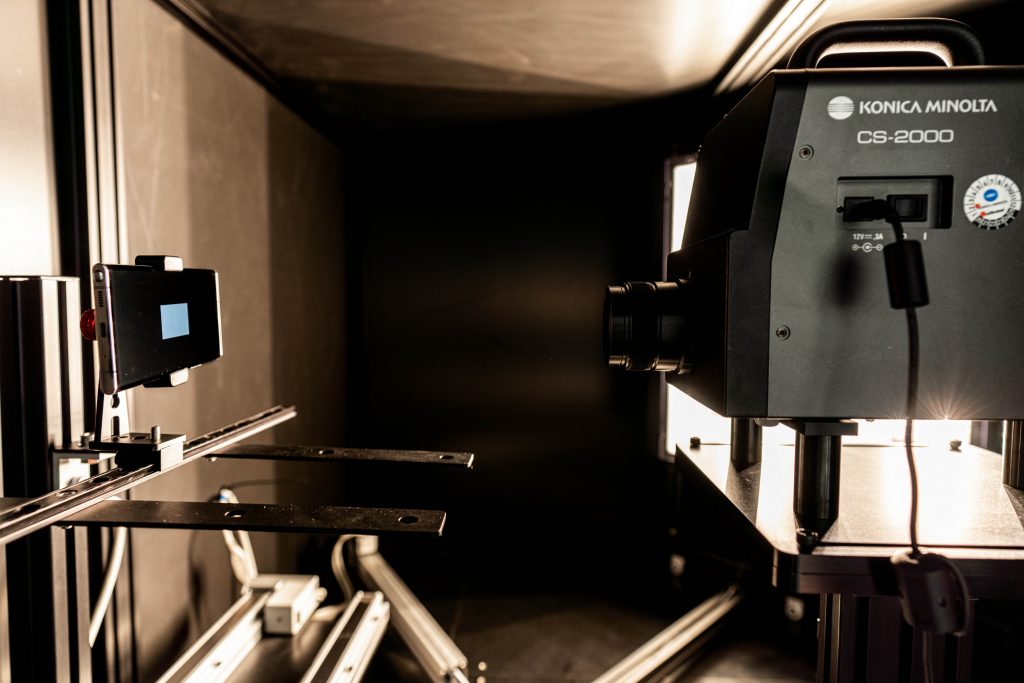
In both photos showing the inside of the DXOMARK Display Bench above, you can see a device under test (DUT) mounted on the left, with the testing instrument on the right mounted on a rail; testing engineers use computer-controlled servo motors to move the instrument to various distances from the DUT. During testing, the Bench is first sealed against any external light sources, and an engineer controls the tests via computer.
Perceptual testing tools
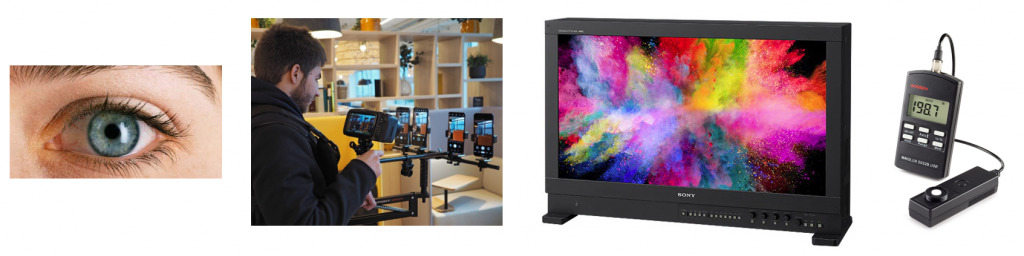
One of the most important tools DXOMARK relies on for its perceptual testing is the human eye. Our perceptual tests confirm and complement our objective tests, in that we want to be sure that we can see in real life what the objective measurements are telling us. Further, objective tests measure only what they are strictly aiming to measure. Given the complexity the software driving the display as well as the complexity of the human eye, perceptual tests are an essential ingredient in evaluating display quality.
Our Display protocol engineers receive careful and extensive training before conducting any perceptual tests, some of which involve closely evaluating multiple devices (a DUT and two or three comparison devices) against reference images displayed on a professional monitor. The color and brightness values of each carefully chosen image on the pro display have been precisely calibrated and measured. When making comparisons, engineers follow a very strict and scientifically sound protocol that requires conducting the test multiple times using different engineers each time so as to ensure against bias.
Our engineers perform all perceptual evaluations by looking directly at the device’s display. We take photos only to use as illustrations, but never use them as a basis for any kind of test or evaluation.
Display protocol tests
The tables in each sub-section below cover all of the attributes that the DXOMARK Display protocol currently tests, and include information about the equipment we use, some of the testing conditions, and some of result parameters and definitions.
Readability
In our reviews, we regularly remind people that the most important consideration for end-users is how easily and comfortably they can read the display under different real-life conditions. DXOMARK uses its Display Bench to recreate ambient light conditions ranging from total darkness to bright sunlight. Below is a sample graph of comparison data showing brightness/contrast measurements for three devices:
In the example above, you can see how the measured contrast in daylight conditions does not live up to claimed contrast values of 1:1,000,000 (or infinite), which are based on measurements taken in dark conditions (< 0.01 lux). Our measurements show what users experience — that is it hard to read our screens in sunlight.
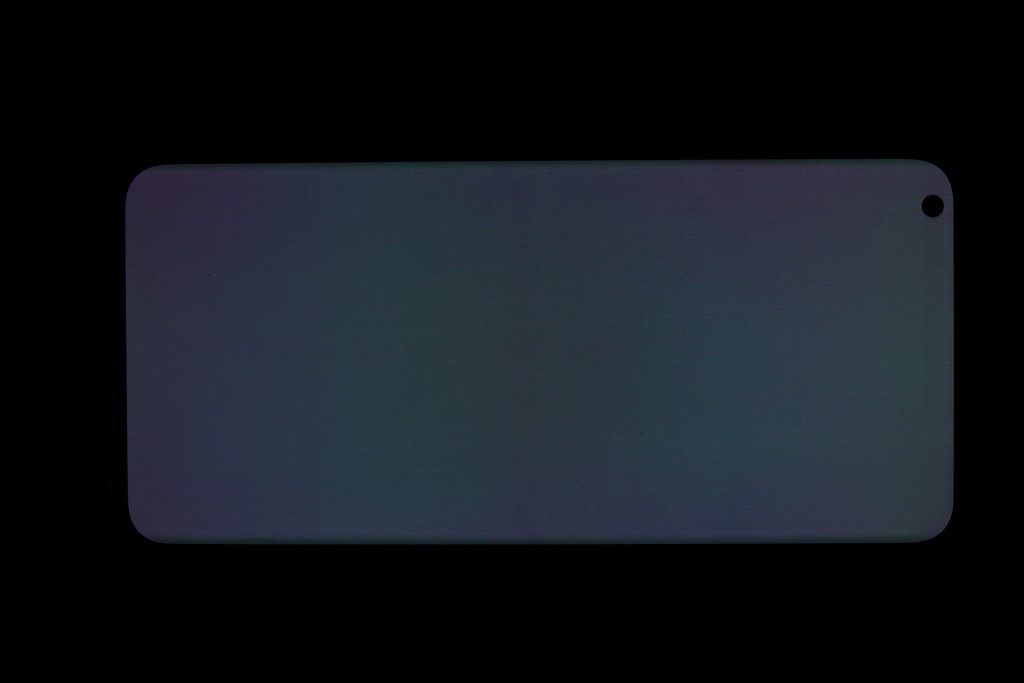
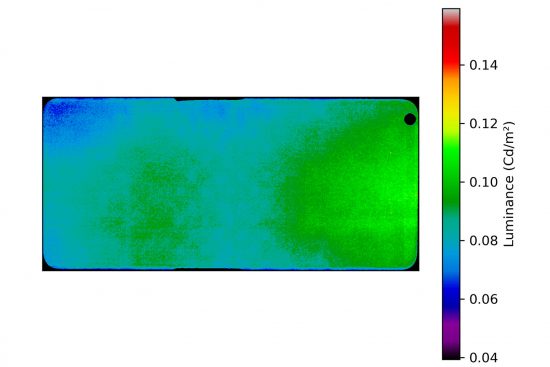
Another test of display readability measures the homogeneity or uniformity of brightness output, as shown in the illustrative image below:
| Readability
Unless specified otherwise, all tests are conducted at light levels ranging from 0 to 30,000 lux and using white color temperature/spectrum tungsten, white LED, D65 color illuminants, etc. |
||
| Sub-attribute | Equipment | Remarks |
| Vs. ambient lighting | Bench + spectroradiometer (brightness, given as cd/m2) + video colorimeter (contrast, given as :1) | Brightness should adapt to viewing conditions; screen content should be readable in any condition and be as close as possible to original intent. |
| Vs. average pixel level | Bench + spectroradiometer (brightness) + video colorimeter (contrast) | Neither brightness nor contrast should change with APL. |
| Brightness vs. time | Light booth with changing lights and brightness levels | We investigate reaction time, smoothness, transition time |
| EOTF* | Bench + spectroradiometer | Tested under various light conditions at 20% APL; the closer to the target value of gamma, the better. |
| Uniformity | Video colorimeter + standard lens | Tested at 0 lux; results are given as a percentage (the higher, the better). |
| Vs. angle | Video colorimeter + conoscope | Tested at 0 lux; the lower the loss of brightness, the better. |
| Blue light filter impact | Bench + spectroradiometer | Brightness should not significantly change; a drop of less than 20% in cd/m2 is acceptable. |
*EOTF stands for Electro-Optical Transfer Function, which converts an electronic signal into a particular level of brightness on a display.
Color
From the end-user’s point of view, color fidelity — that is, having the display faithfully reproduce the exact same hues and shades that they see with their eyes — is second in importance only to readability.
We use a conoscope in the setup below to evaluate how color shifts when users view display content on axis versus when they look at content on a screen held off axis (tilted up to 70°).
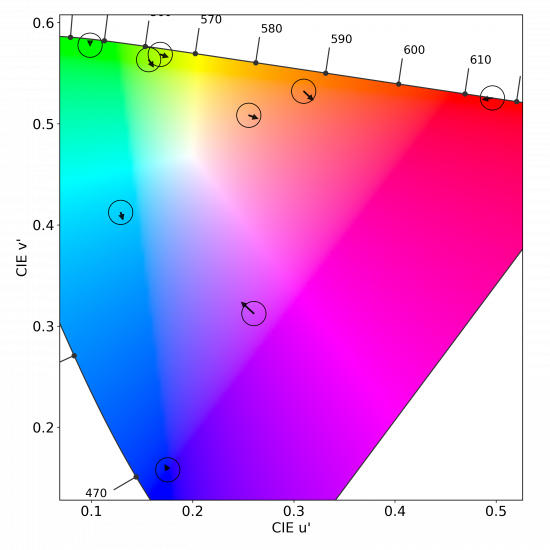
We perform color fidelity measurements for different lighting conditions to see how well the device can handle color management under different ambient lighting conditions. Below is just one of our color fidelity results taken under a D65 illuminant at 1000 lux.
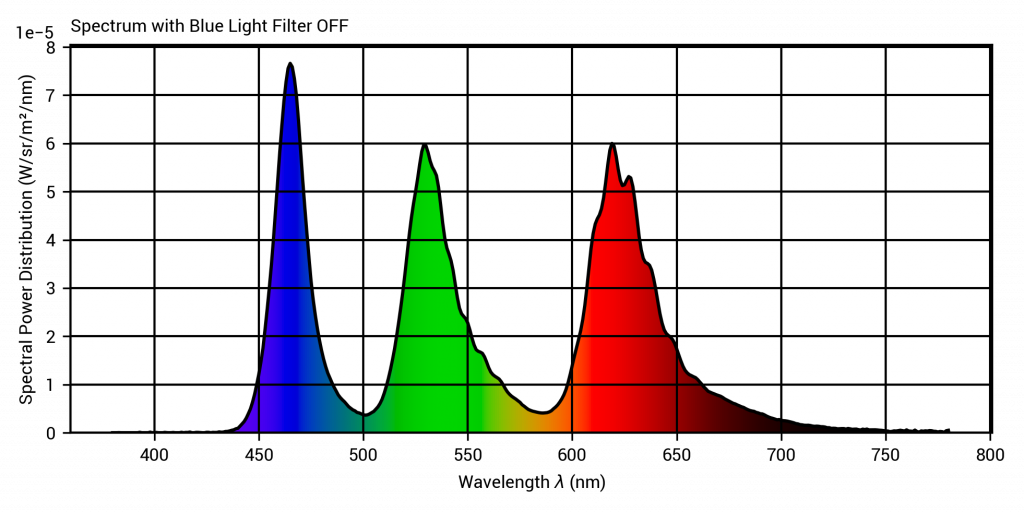
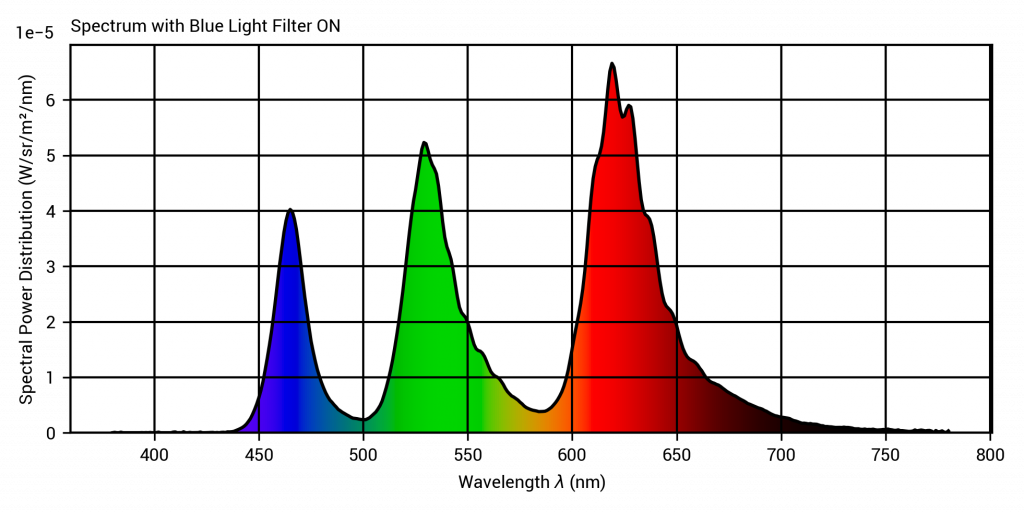
Most smartphone manufacturers include a feature we refer to as a blue light filter (BLF); DXOMARK measures how effectively a phone reduces blue light, and what its impact is on overall display color rendering.
|
Color Unless specified otherwise, all tests are conducted at light levels ranging from 0 to 30,000 lux and using white color temperature/spectrum tungsten, white LED, D65 color illuminants, etc. |
||
|
Sub-attribute |
Equipment |
Remarks |
|
White point vs. ambient lighting |
Bench + spectroradiometer |
Result is the color temperature of the white point of the device (in Kelvin). |
|
White point vs. time |
Light booth |
We investigate if the white point adapts to changes in ambient brightness, and if such adaptation is smooth. |
|
Gamut vs. ambient lighting |
Bench + spectroradiometer |
Result is a percentage of the color gamut coverage (the higher, the better). |
|
Color fidelity |
Bench + spectroradiometer |
Results are the color difference between the target and the measurement, given in JNCD (“just noticeable color difference”). |
|
Vs. angle |
Video colorimeter + conoscope |
Tested at 0 lux, results are the color difference expressed as JNCD; the less noticeable the color shift, the better. |
|
Uniformity |
Video colorimeter + standard lens |
Tested at 0 lux; the fewer the color differences across the screen, the better. |
|
Blue light filter impact |
Bench + spectroradiometer |
Tested at 0 lux; blue component wavelength should decrease without changing the gamut. |
Video
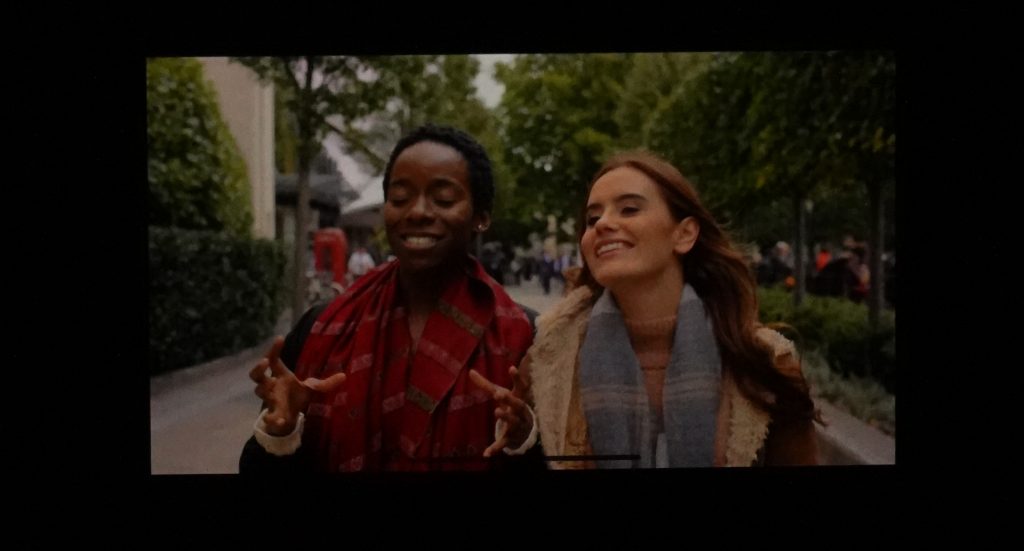
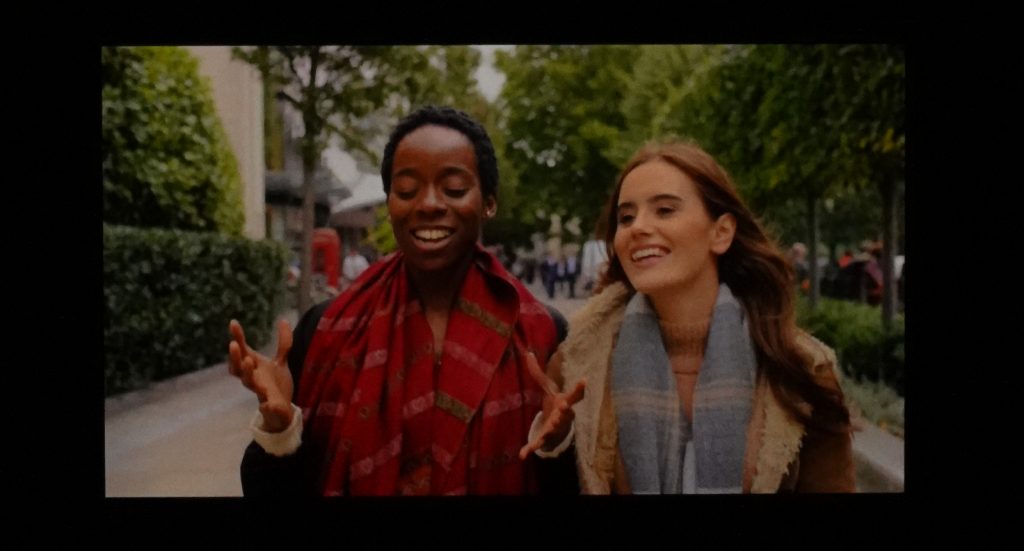
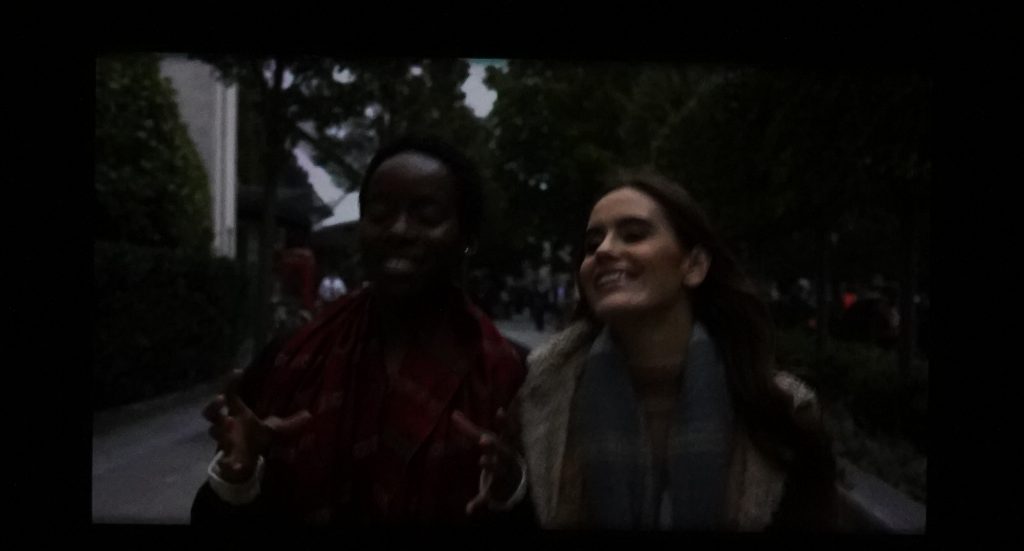
A device may be good at handling still image content but fall down when handing video, and vice versa. DXOMARK tests displays using the device’s default video app. In the images below used to illustrate video test results, you can see that the device on the left has low brightness but is still visible; the image in the center has good brightness; and the device on the right is quite dark. As for color, the left-hand device shows good color rendering; the middle device has a yellow cast; and the right-hand device is too blue.
|
Video Tested in standardized conditions at 5 cd/m2 and in natural indoor lighting. |
||
|
Sub-attribute |
Equipment |
Remarks |
|
Brightness |
Bench + spectroradiometer |
Device brightness should be visually comfortable in low-light and indoor conditions |
|
Contrast |
Bench + video colorimeter |
Device contrast should stay above target |
|
EOTF |
Bench + spectroradiometer |
Rendering of details in dark tones, midtones, and highlights should be as close as possible to that of the target reference screen, and maintained in indoor conditions. |
|
Color |
Bench + spectroradiometer |
Color must be as close as possible to the target reference screen and maintained in indoor conditions. |
Motion
DXOMARK tests how well a display handles moving content. The left-hand image below shows our setup for testing motion blur, and the middle and right-hand images show sample test output.
We evaluate motion blur perceptually by looking at frame duplications. The left-hand image below shows the setup we used to take the center and right-hand pictures below to illustrate what we evaluated perceptually. (We did not base any of our test results on these pictures.)

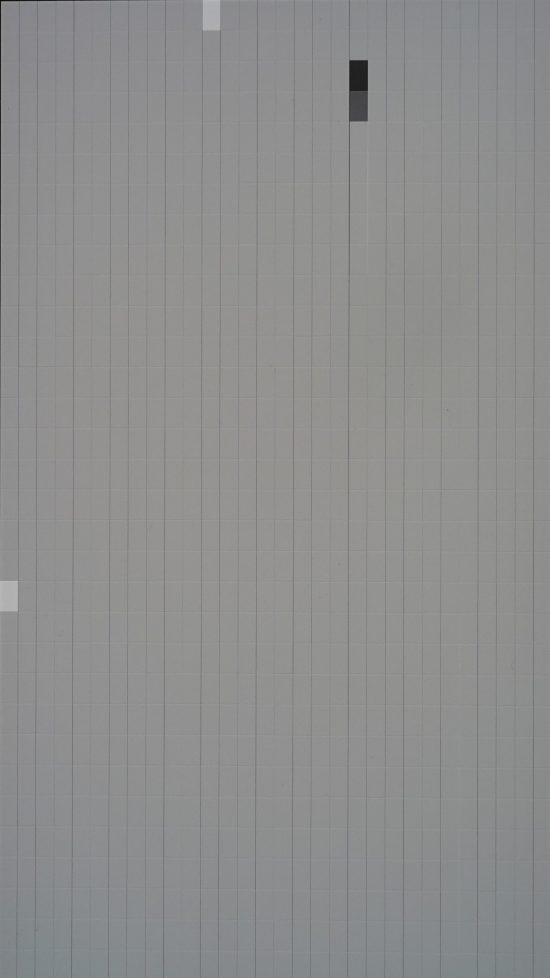
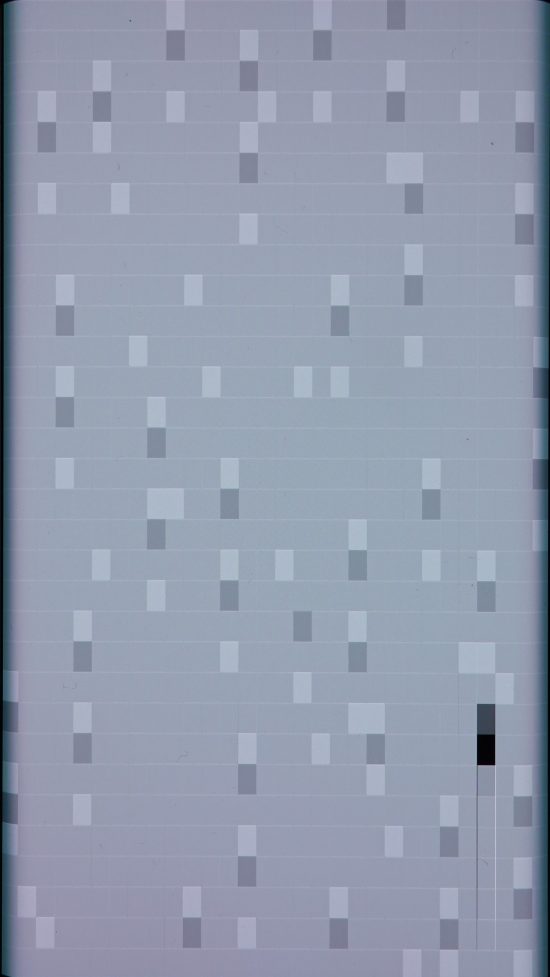
Other motion phenomena we test for are stutter and frame drops. The photo on the left shows our stutter/frame drop testing setup; the GIF on the right illustrates the test video output of a white rectangle that is lit in successive frames.

In the illustrative images below, a black or dark gray rectangle indicates a frame drop (that is, when the display fails to display a frame properly before directly moving to the next one), and a white rectangle indicates stutter (that is, the display displays a frame twice before moving to the next one).
|
Motion Tested in indoor conditions (300–1000 lux) |
||
|
Sub-attribute |
Equipment |
Remarks |
|
Frame drops |
Compact camera |
Tested at 0 lux, absolute number of stutter indicators (white) and frame drops (black) between 0 and 100 for a 32-second clip |
|
Motion blur |
The smoother the image, the better |
|
|
Video playback reactivity |
Device should react instantly and show no lag in playback when jumping backwards and forwards in a video. |
|
Touch
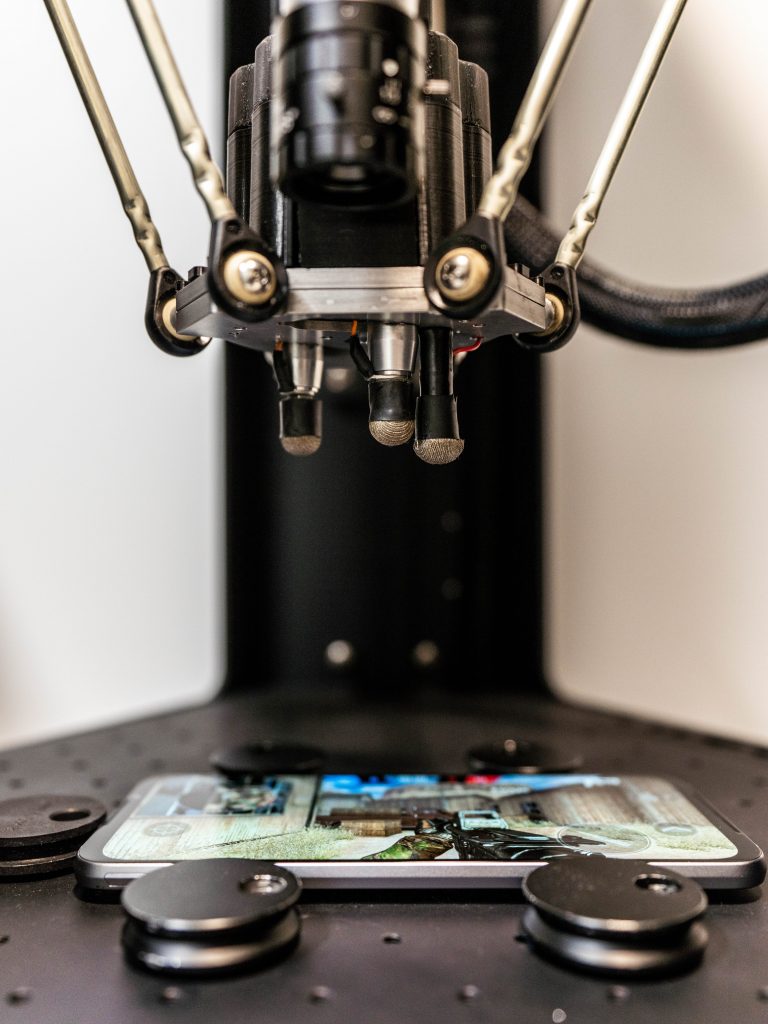
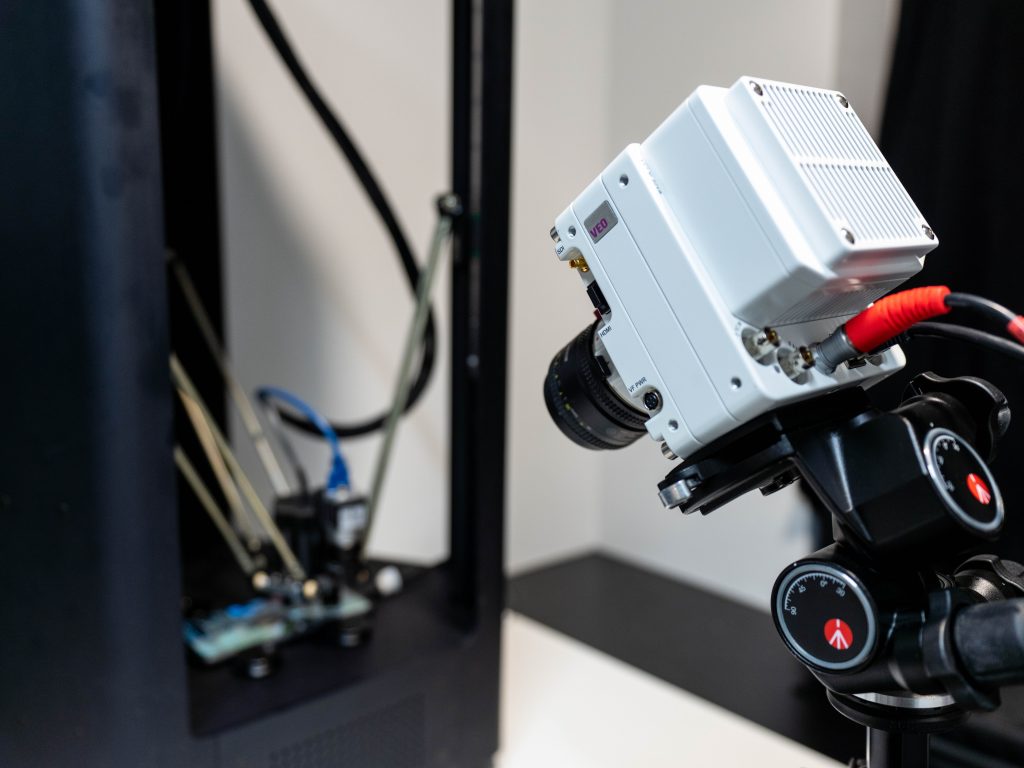
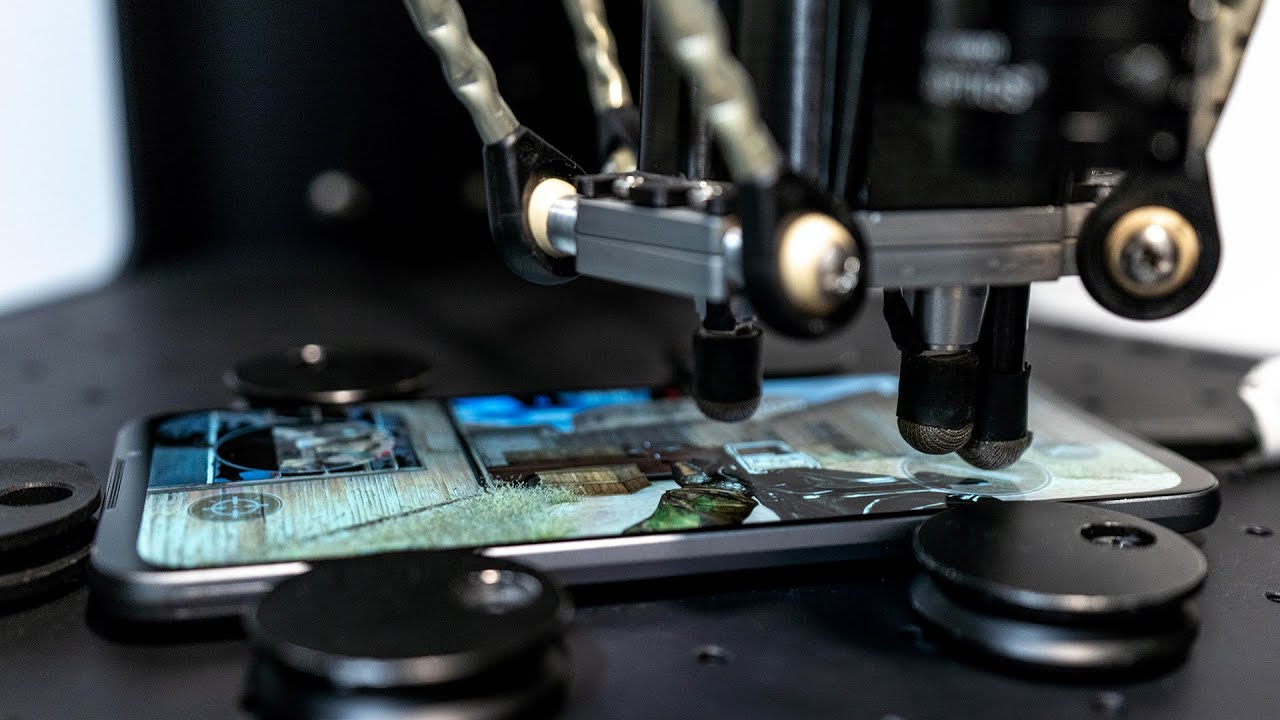
As shown below, we have a set of high-end measuring instruments for performing touch analyses, including a robot that simulates human gestures (tap, zoom, and scroll) on a touchscreen with a precision of 0.05 mm at 1.5 m/s. In addition, we use a high-speed Phantom camera that records 1440 images per second for slow-motion capture of each frame on a smartphone display.
In the video below, you can see a meaningful example of the results we obtain with our setup for touch response time measurement. In our gaming use case, the device on the left reacts three times faster than the device on the right, with response times of 3 ms and 10 ms, respectively.
In example below showing smoothness, we observed during testing that the device on the left is not smooth and that the one on the right is very smooth when scrolling horizontally in a smartphone’s gallery app. The illustrations accurately depicts the phenomenon: on the left, we see a few sporadically spaced images, while there are many more evenly spaced images on the right.


| Touch
Tested in indoor conditions (300–1000 lux) |
||
| Sub-attribute | Equipment | Remarks |
| Response time | Touch robot & high-speed camera | Touch response time measured in gaming use case |
| Accuracy | Touch robot & high-speed camera | Accuracy error and repeatability measurement.
Touch inaccuracy on the edges of the screen |
| Smoothness | The smoother the better | |
Artifacts
The DXOMARK protocol includes checking for performance, design, and image rendering flaws that can impact the end-user experience. For example, flicker tests reveal that slow pulse-width modulation (PWM) can have an impact on visual comfort even for devices with a high refresh rate. (In the graph below, the first spike corresponds to the refresh rate, and the highest spike corresponds to the PWM.)
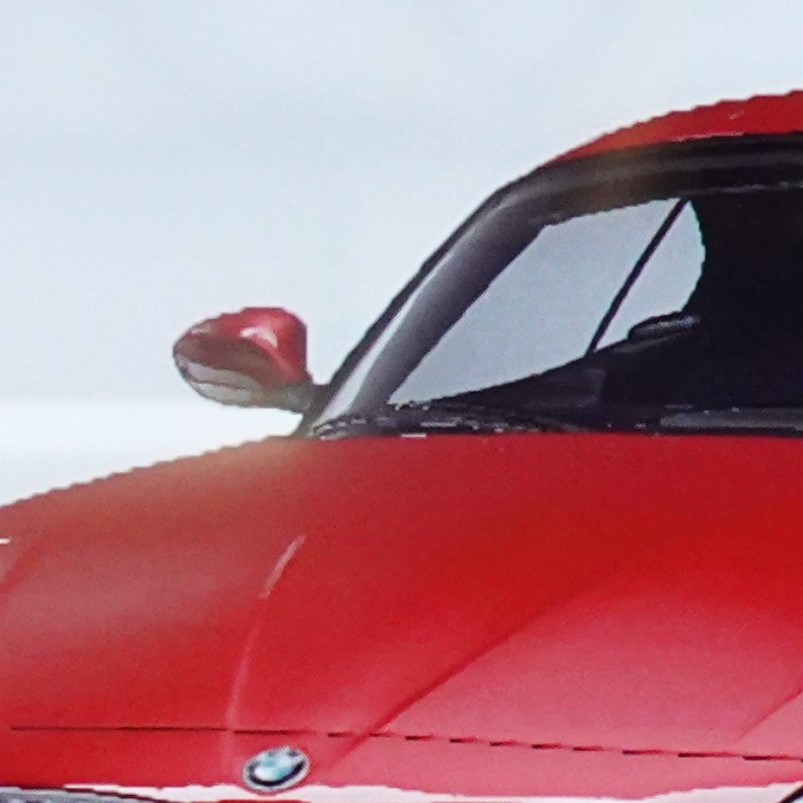
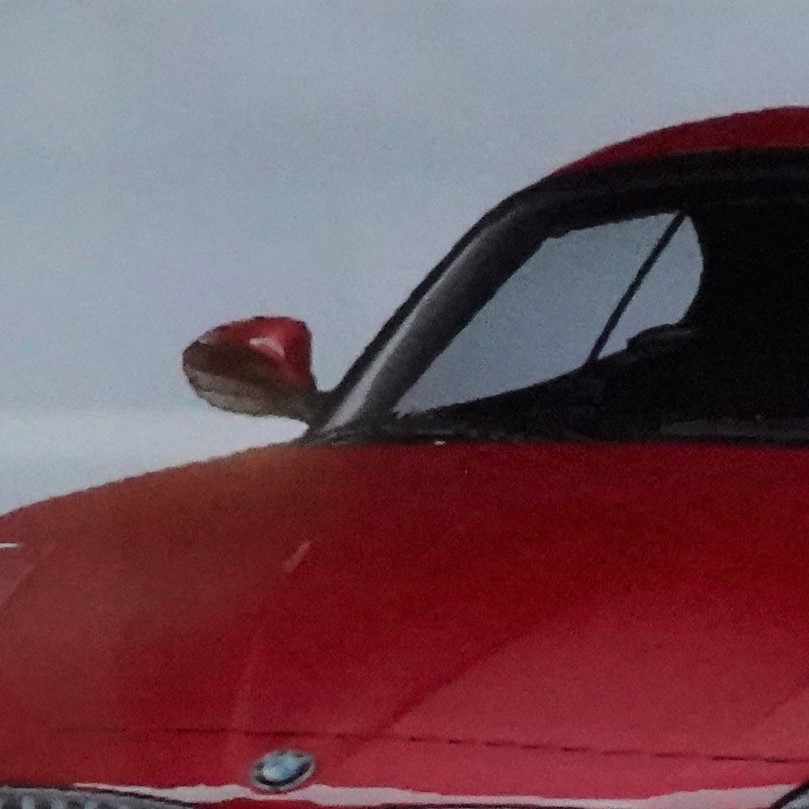
Rendering curved lines is a challenge for all displays; evaluating how well a device avoids the appearance of stair-stepping (known as aliasing) is part of our protocol.

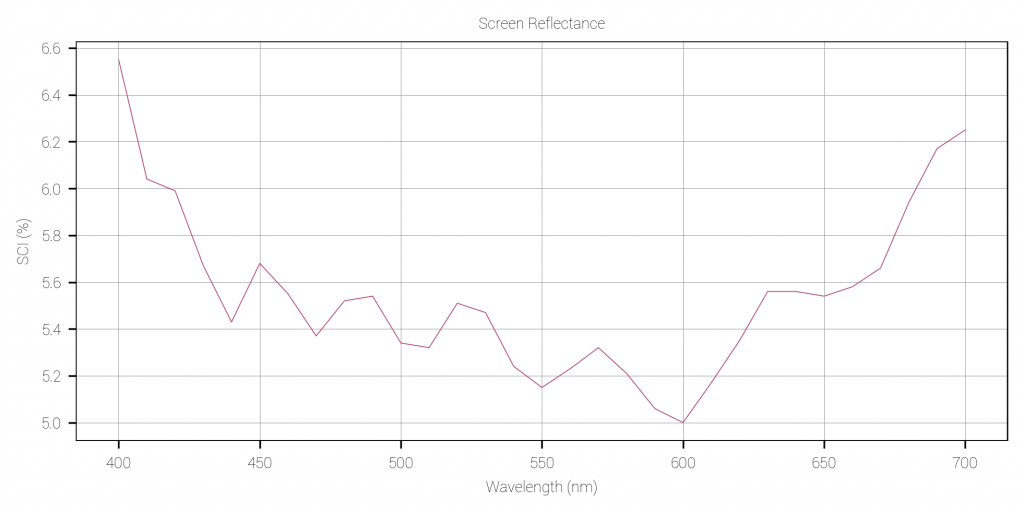
We also use our spectrophotometer in SCI (Specular Component Included) mode to perform reflectance level measurements on smartphone displays that are turned off. Below are measurements that show the reflectance level for each 10 nm-spaced wavelength within the visible spectrum range (400 nm to 700 nm).
|
Artifacts |
||
|
Type |
Equipment |
Remarks |
|
Notch disturbance |
DSLR |
DXOMARK objectively measures screen-to-body ratio. How problematic the notch’s size and position is on the screen is determined perceptually. |
|
Screen reflectance |
Spectrophotometer (+ glossmeter with display off) |
A reflectance result of under 4% is considered good. |
|
Flicker |
Flickermeter |
Flicker frequency corresponds to the highest peak on the graph. The higher the frequency, the better. |
| DSLR |
The smoother the curves and thus less noticeable stair-stepping effects, the better |
|
| Compact camera |
Video content evaluation at 24, 30, and 60 fps |
|
Conclusion
In our tests, we perform more than 400 measurements and 20 hours of perceptual analysis. These measurements are conducted in dark environments as well as in challenging indoor and outdoor lighting environments to imitate the end-user experience.
While having the latest high-quality panel on your smartphone is a good start toward reaching good display quality, it’s not enough. As we said earlier, display performance quality does not solely depend on hardware specifications, but also on the software and SW/battery strategy choices that manufacturers make to try to optimize end-user comfort across different use cases.
We hope this article has given you a more detailed idea about some of the scientific equipment and methods we use to test the most important characteristics of your smartphone display. Stay tuned for our upcoming in-depth series, and until then, stay safe and healthy!
DXOMARK invites our readership (you) to post comments on the articles on this website. Read more about our Comment Policy.