 English
We put the Oppo Reno8 5G through our rigorous DXOMARK Display test suite to measure its performance across six criteria. In this test results, we will break down how it fared in a variety of tests and several common use cases.
Overview
Key display specifications:
- 6.43 inches AMOLED (~85.6% screen-to-body ratio measured)
- Dimensions: 160.0 x 73.4 x 7.67 mm (6.30 x 2.89 x 0.30 inches)
- Resolution: 1080 x 2400 pixels, (~409 ppi density)
- Aspect ratio: 20:9
- Refresh rate: 90 Hz
Scoring
Sub-scores and attributes included in the calculations of the global score.
 Oppo Reno8 5G
Pros
- Fluid touch when browsing and when playing video games
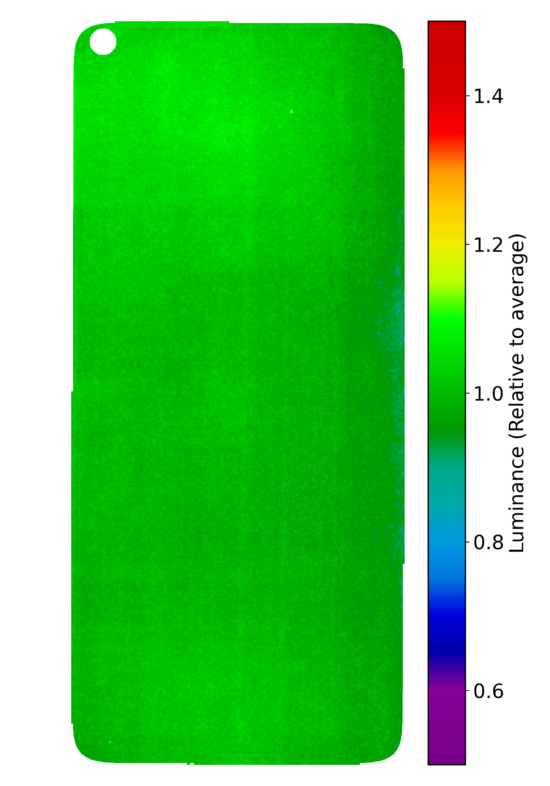
- Mostly uniform brightness and color
- Well-defined lines when playing video games
Cons
- Lacks readability under sunlight
- Poor video performances, especially in terms of colors and brightness
- Visible screen iridescence when viewed in angle
The Oppo Reno8 5G display was overall very readable in various conditions, except under sunlight, and was quite good when it came to touch performance.
Despite the screen’s lack of brightness in outdoor conditions, when the device was under challenging sunlight conditions, dark tones were automatically enhanced, allowing for better readability. This difference in screen readability was also quite significant when compared with the readability of the Pro version of the phone, which struggled in the sunlight.
The Oppo Reno8 5G performed very well in the video game use case, thanks to the display’s smoothness, touch accuracy, detail level, and aliasing management.
Where the Oppo Reno8 5G display really fell short was in videos. The display’s low video brightness and the overly dark tones was quite distracting that it interfered with watching movies and videos comfortably.
Test summary
About DXOMARK Display tests: For scoring and analysis in our smartphone and other display reviews, DXOMARK engineers perform a variety of objective and perceptual tests under controlled lab and real-life conditions. Note that we evaluate display attributes using only the device’s built-in display hardware and its still image (gallery) and video apps at their default settings. (For in-depth information about how we evaluate smartphone and other displays, check out our articles, “How DXOMARK tests display quality” and “A closer look at DXOMARK Display testing.”
The following section gathers key elements of our exhaustive tests and analyses performed in DXOMARK laboratories. Detailed performance evaluations under the form of reports are available upon request. Do not hesitate to contact us.
Readability
Oppo Reno8 5G
160
Readability evaluates how easily and comfortably users can read still content (photos & web) on the display under different real-life conditions. DXOMARK uses its Display Bench to recreate ambient light conditions ranging from total darkness to bright sunlight. In addition to laboratory tests, perceptual analysis is also made in real-life environments.


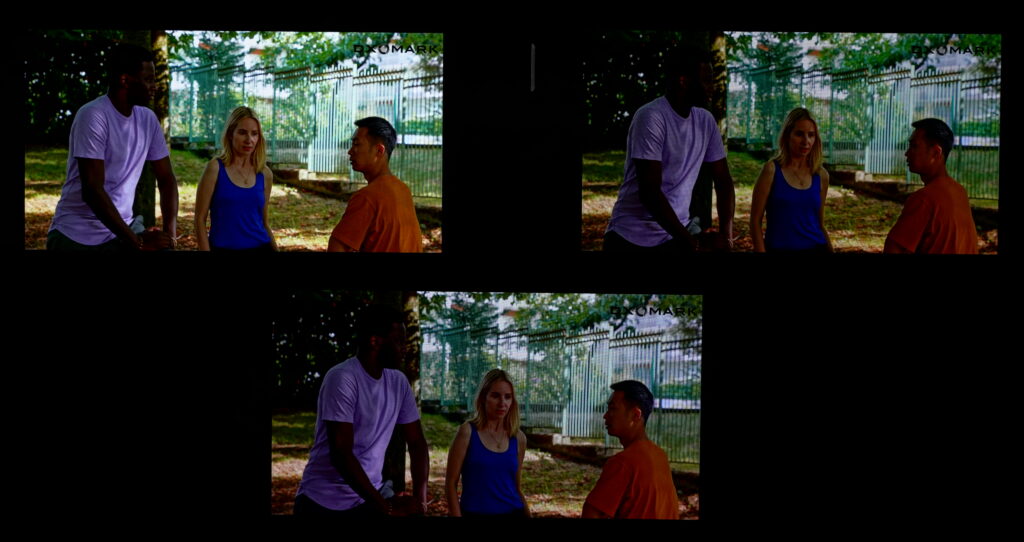
In these illustrations, we can see that the Oppo Reno8 5G screen above left, outperformed its bigger sibling, the Reno8 Pro, below left, in challenging sunlight conditions. The Reno8 5G showed improved readability by increasing its dark tones thanks to its High Brightness mode.
 From left to right: Oppo Reno8 Pro 5G, Oppo Reno6 Pro 5G, Xiaomi 11T
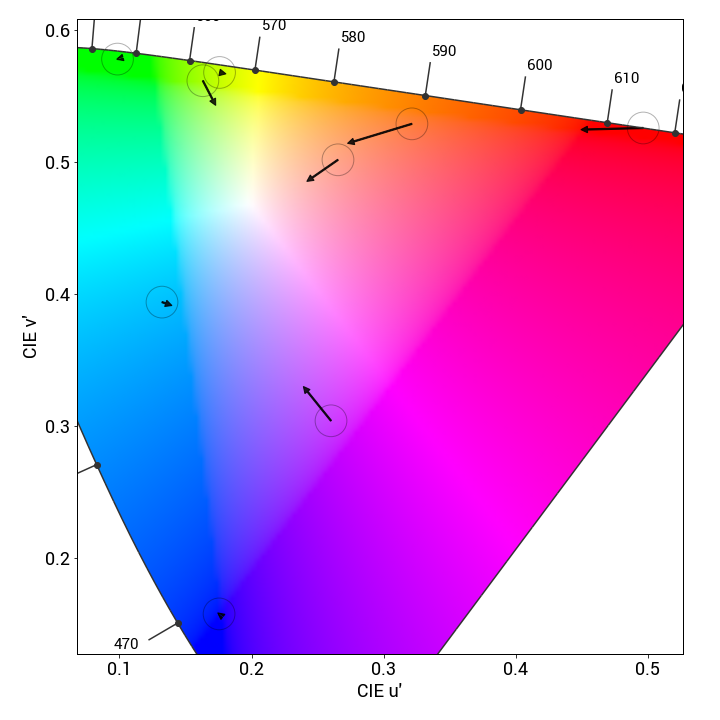
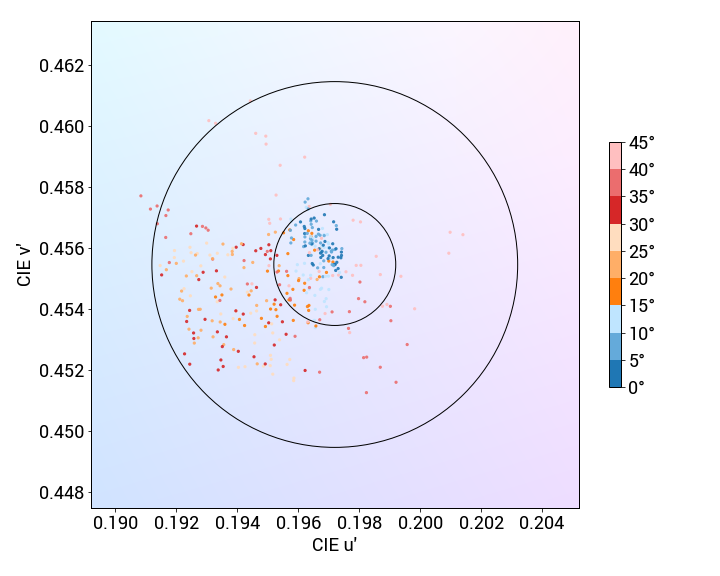
Color
Oppo Reno8 5G
163
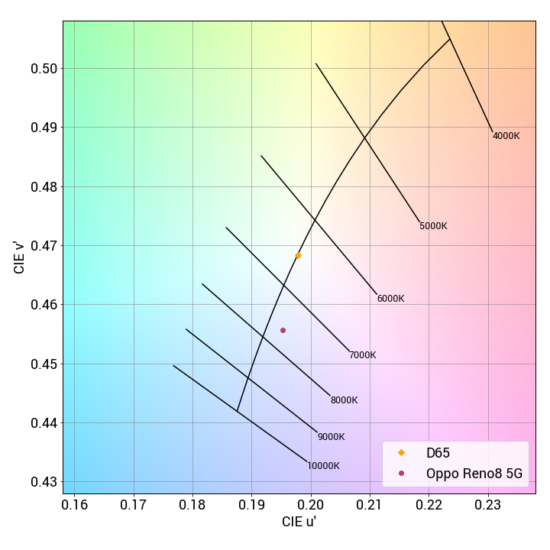
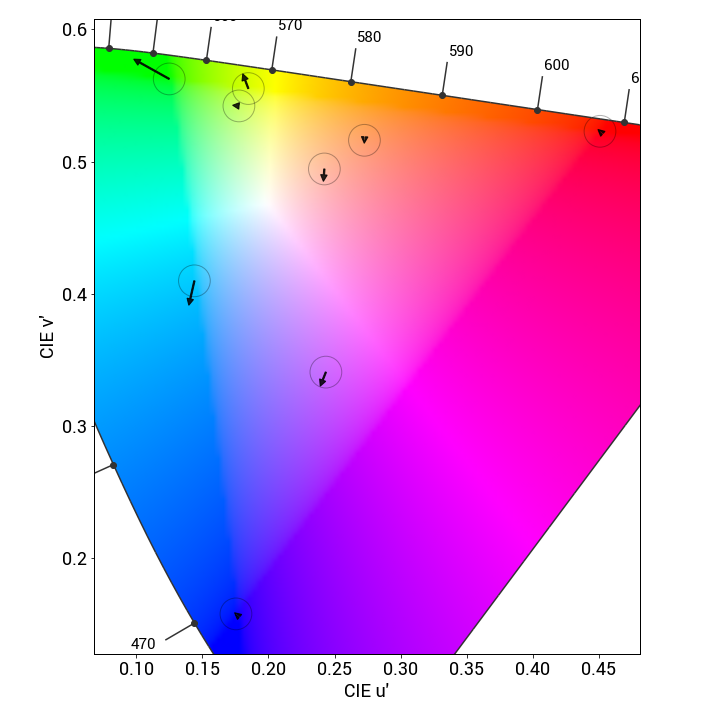
The color attribute evaluates the capacity of the device to accurately reproduce colors. The measurements taken are for fidelity, white point color, and gamut coverage. We perform color evaluations for different lighting conditions to see how well the device can manage color in the surrounding environment. Colors are measured using a spectrophotometer in a controlled lighting environment. Perceptual analysis of color rendering is against the reference pattern displayed on a calibrated professional monitor.
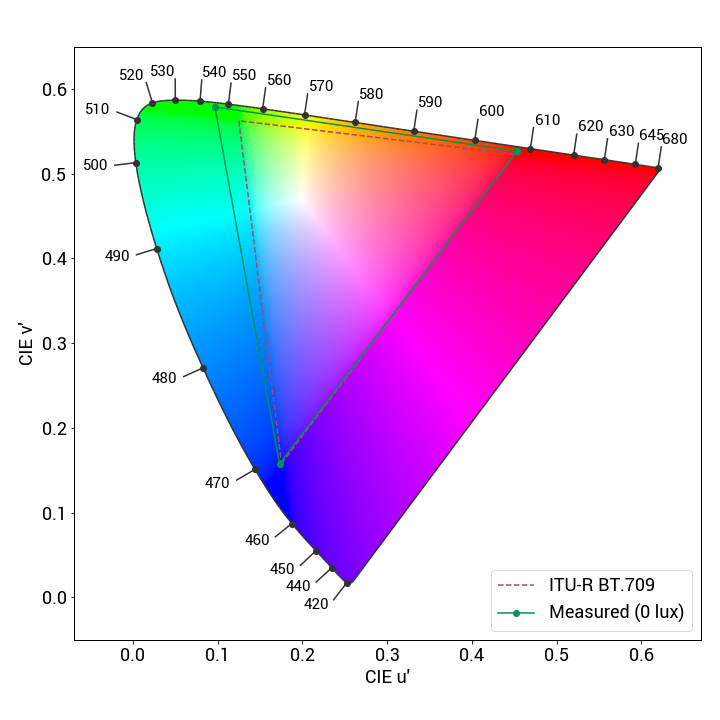
Video
Oppo Reno8 5G
162
Our video attribute evaluates the Standard Dynamic Range (SDR) and High Dynamic Range (HDR10) video handling of each device in indoor and low-light conditions. We measure tone mapping, color gamut, brightness and contrast of the display. We perform perceptual analysis against our professional reference monitor (Sony BVM-HX310) to ensure that the rendering respects the artistic intent.

Motion
Oppo Reno8 5G
155
The motion attribute evaluates the handling of dynamic contents. Frame drops, motion blur, and playback artifacts are scrutinized using games and videos.
Touch
Oppo Reno8 5G
165
To evaluate touch, DXOMARK uses a touch robot and a high-speed camera to play and record a set of scenarios for smoothness, accuracy and response-time evaluation.
Oppo Reno8 5G 149Artifacts
Evaluating artifacts means checking for the performance, image rendering and motion flaws that can affect the end-user experience. DXOMARK measures precisely the device’s reflectance and the presence of flicker, and assesses the impact of residual aliasing when playing video games, among other characteristics.
DXOMARK invites our readership (you) to post comments on the articles on this website. Read more about our Comment Policy.